| App | Free plan | Platforms | Intuitive | Best For |
|---|---|---|---|---|
|
✔️ |
Web, iOS, Android |
★★★★★
|
Everyone |
|
|
✔️ |
Web, iOS, Android |
★★★★★
|
Beginners and pros |
|
|
✔️ |
Web |
★★★★☆
|
Interactive presentations |
|
|
✔️ |
Web |
★★★★☆
|
Data visualization |
|
|
✔️ |
Web |
★★★★☆
|
Interactive and responsive website visuals |
|
|
✔️ |
Web |
★★★★☆
|
Presenters, teachers, marketers |
|
|
✔️ |
Web |
★★★☆☆
|
Infographics and on-brand documents |
|
|
✔️ |
Web |
★★★★☆
|
Engaging animated content |
|
|
✔️ |
Web, Windows, macOS |
★★★★☆
|
Educators and professionals |
|
|
✔️ |
macOS, iOS |
★★★★☆
|
Presentations on Apple devices |
|
|
✔️ |
Web, iOS, Android |
★★★★★
|
Novice graphic designers |
|
|
✔️ |
Web |
★★★★☆
|
Simple graphics |
I used Piktochart because it has a streamlined drag-and-drop UI with a collection of templates that can be used for illustrating a variety of photography concepts. Using them, I can explain composition rules, color theory, and widely-used retouching techniques. This is why I started to look for an alternative with similar functionality.
Piktochart has limited customization options. I wanted to find a solution that allows me to customize designs to my liking depending on the course content. Besides, I was looking for a Piktochart alternative with more advanced collaboration options.
I wanted to find a program that integrates with other services, including Google Drive and Adobe Creative Cloud. I was looking for a service with integrated analytics tools that enable me to track student engagement and adjust my materials using this data.
Platforms: Web, iOS, Android
Best for: Beginners and creative professionals looking for an easy-to-use design tool
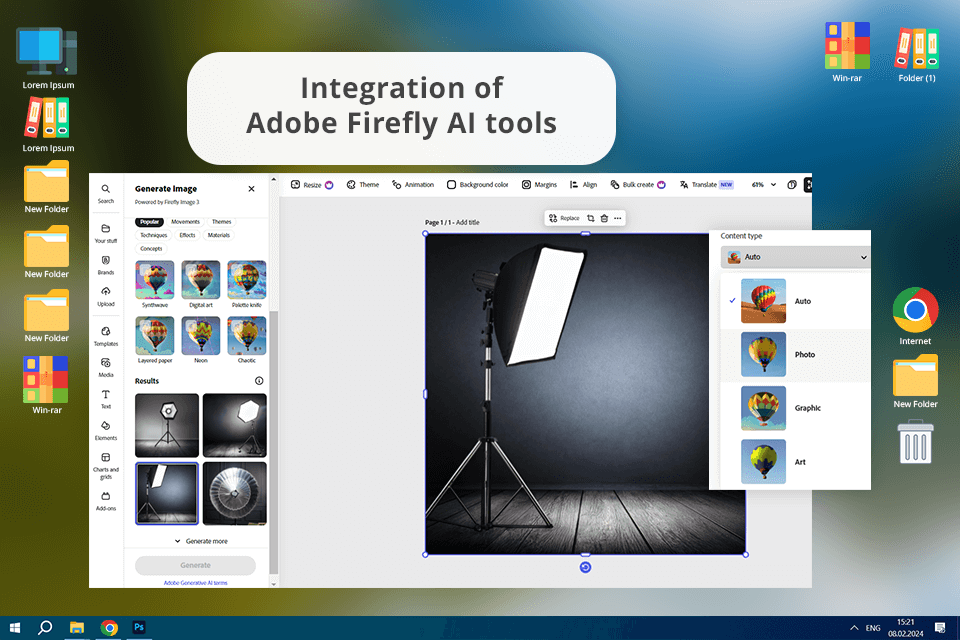
When I started to use Adobe Express, I was impressed by its perfect balance between simplicity, powerful functionality, and usability. It is the best alternative to Piktochart as it comes with a large library of easy-to-adjust templates listed under various categories, including Adobe Express education templates. Due to this, I was able to quickly find the best option for my projects.
Using this software, I could produce presentations for my online classes, engaging social media content, and attention-grabbing printed materials depicted the main photography concepts. Adobe Express has both essential and professional editing tools. Using them, I can crop and resize my pics, manage layers, and create vector graphics. It allows me to create both basic infographics and intricate designs.
I was also impressed by the fact that Adobe Express comes with convenient AI-powered tools. Using them, I can generate pictures based on text prompts, create templates, or produce text effects. Besides, I like its integration with other Adobe CC software. The program comes with convenient collaboration tools, making it easier for me to work with my colleagues.
Face-to-face comparison:
| Feature | Adobe Express | Piktochart |
|---|---|---|
|
Template variety |
Many customizable templates |
Mostly suitable for infographics |
|
Multimedia support |
Strong media integration
|
Limited |
|
Image enhancement
|
AI-driven tools |
Basic image editing |
|
Video editing
|
✔️ |
Limited video support
|
|
Collaboration |
Real-time collaboration
|
Basic |
Pricing: Adobe Express free plan, from $9.99/month or $99/year.
Platforms: Web, iOS, Canva for Android, Canva for iPad
Best for: Beginners, creators, and professionals to create high-quality professional designs
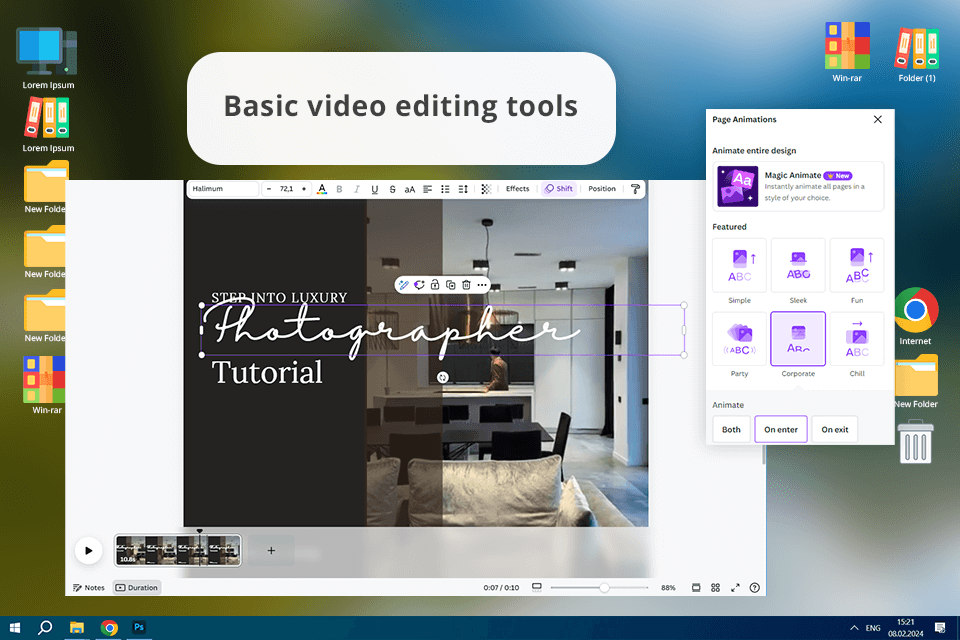
Canva has a collection of over 250,000 templates, which allows me to use it for creating presentations, social media posts, and educational materials to make my classes more engaging and add branding elements to my content. Using this alternative to Piktochart, I was able to create PDFs, worksheets, and even certificates customizing the templates depending on my needs.
Thanks to the collection of stock photos, icons, illustrations, and fonts, I was able to design engaging materials to explain photography concepts in a comprehensible way. If you compare Canva vs Piktochart, you will see that the former is better, as it integrates with learning management platforms. It allows me to share a variety of resources throughout my course.
Canva photo editor also comes with essential tools for editing videos. I was pleasantly surprised by the fact that it has them. Using them, I was able to create short video lessons on live photo editing with short video segments, text overlays, and transitions.
Face-to-face comparison:
| Feature | Canva | Piktochart |
|---|---|---|
|
Template variety
|
Over 250,000 templates
|
Focused on infographics |
|
Multimedia support
|
Extensive asset library
|
Limited |
|
Video editing |
✔️ |
Limited video support |
|
Collaboration
|
Real-time collaboration
|
Basic
|
|
Branding tools |
Brand kit
|
Limited |
Pricing: free, from $12.99/month or $119.99/year
Platforms: Web
Best for: Businesses, marketers, and educators for interactive presentations and on-brand docs
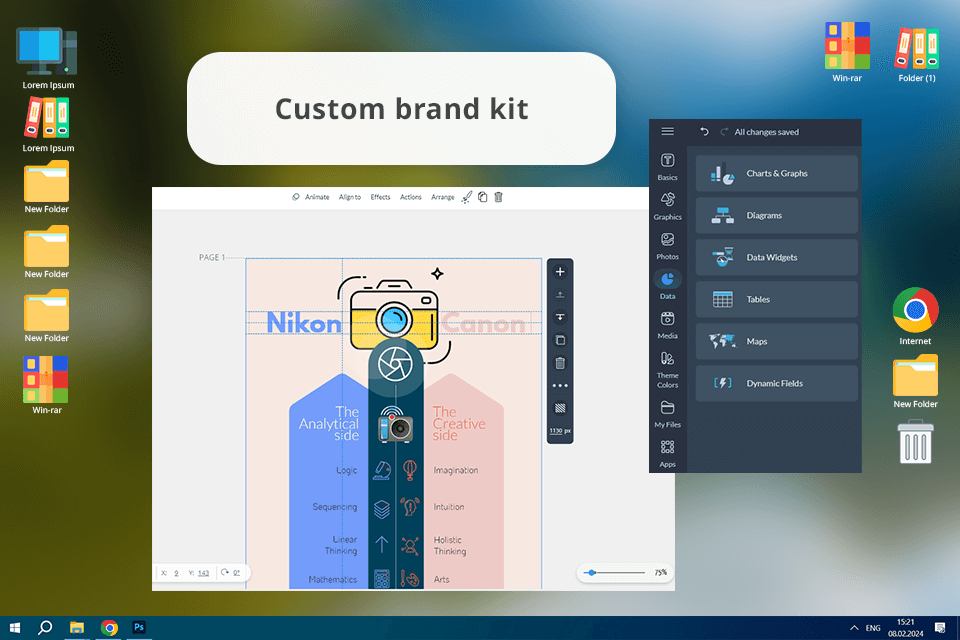
What impressed me about this software is that it has a wide choice of interactive templates suitable for creating educational content. I can customize them depending on my preferences. Visme comes with a powerful photo editor where I can crop, resize, and improve pictures. It allows me to expedite the editing process using AI tools, remove the background, tweak colors, and prepare illustrative materials on lighting and composition concepts.
This 3D presentation software also comes with essential video editing tools. Using them, I can quickly create video tutorials. Another thing that I like about Visme is that it supports SCORM and xAPI export options. It allows me to make my materials available via various Learning Management Systems, which facilitates tracking student progress and engagement.
Visme also stands out among other alternatives to Piktochart for its data visualization tools. They enable me to generate interactive charts, graphs, and infographics to make my data easier to comprehend. Using Brand Wizard, I can upload my logo and select brand fonts and colors to give my materials a consistent look.
Face-to-face comparison:
| Feature | Visme | Piktochart |
|---|---|---|
|
Template library |
Diverse templates, interactive elements
|
Infographics focus |
|
Data visualization tools
|
Charts and graphs, live data integration
|
Charts and graphs, data import |
|
Multimedia support |
Audio and video integration, voiceovers |
Limited |
|
Collaboration features |
Real-time collaboration, feedback tools |
Basic
|
|
Branding options
|
Custom brand kit |
Limited |
Pricing: free, from $25/month
Platforms: Web
Best for: Marketers and educators focused on data visualization
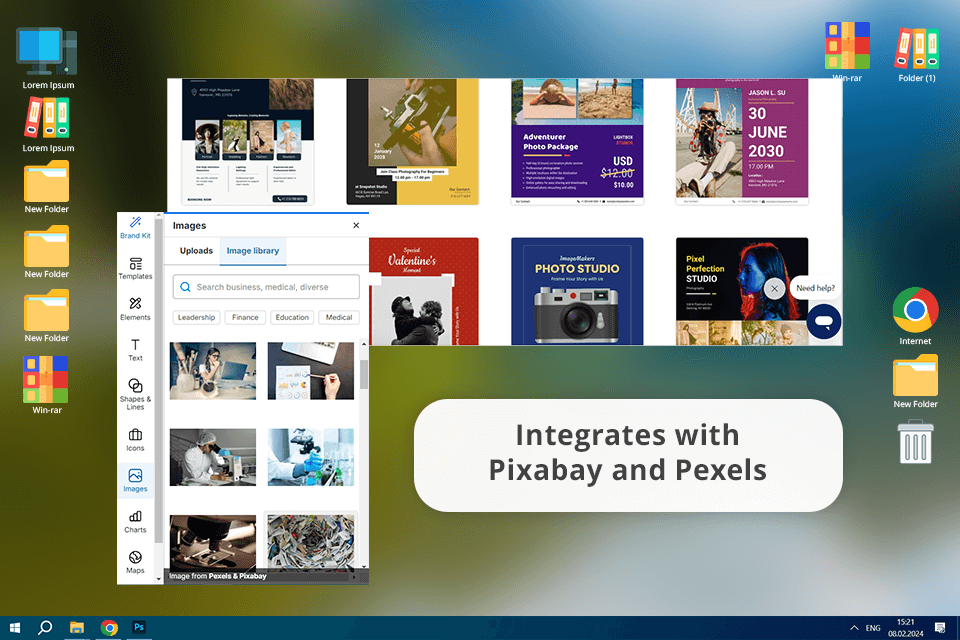
When I started to use Venngage, I was struck by the fact that it had a large library of templates. It contains a lot of professionally designed assets. I just need to drag and drop them to create infographics, presentations, and lesson plans. Another thing that I liked about this free brochure maker was that its templates were designed specifically for educational content.
What makes Venngage an important part of my workflow is that it has handy data visualization tools. Using them, I was able to demonstrate how to use various lenses and adjust settings. Due to this, my students improved the way they use their cameras.
I also liked that, unlike other Piktochart alternatives, Venngage integrates Pixabay and Pexels. Also, I can export my files in PNG, PDF, and HTML formats. Piktochart does not offer this option. In Venngage, I can customize fonts and pictures to adjust my branding elements and ensure they suit the specific themes.
Face-to-face comparison:
| Feature | Venngage | Piktochart |
|---|---|---|
|
Template library
|
10,000+ (2,600+ infographics)
|
About 100 infographic templates
|
|
Data visualization tools
|
Advanced chart maker with data import
|
Basic chart tools |
|
Collaboration features |
Real-time collaboration, custom brand kit
|
Limited |
|
Multimedia support |
Extensive stock images and icons
|
Basic
|
|
AI tools
|
✔️ |
Limited
|
Pricing: free, from $19/month
Platforms: Web
Best for: Data analysts, marketers, and educators for interactive and responsive visuals for websites
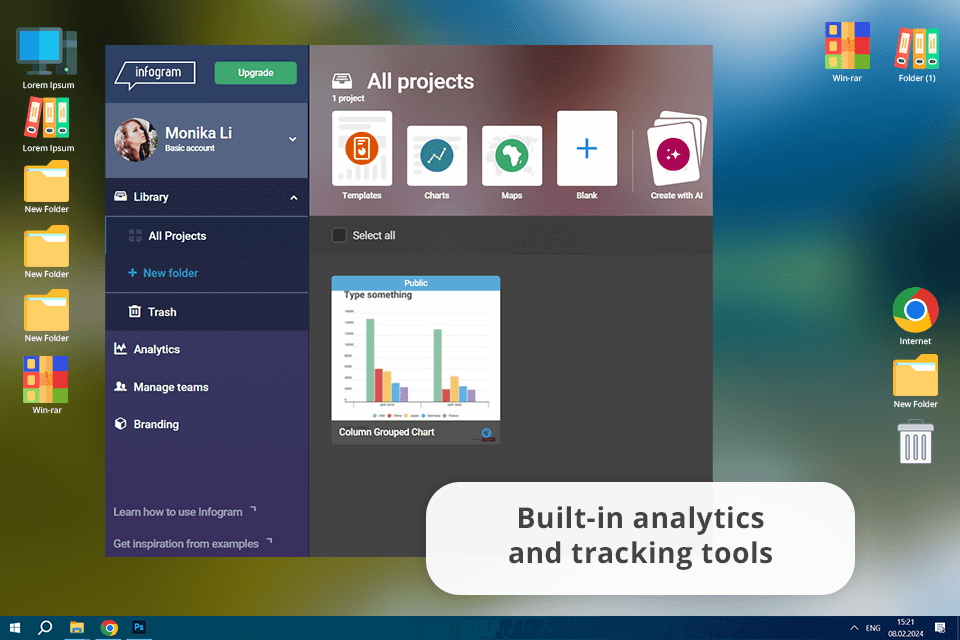
When I decided to test out the tools available in Infogram, I was pleasantly surprised by its data visualization tools. It allows me to create clickable maps and add hover-over information, using which I can explain complex photography concepts. This platform has a library of customizable templates, with many options suitable for educators like me.
This free infographic maker also stands out for its custom branding features. I just need to upload my logo and change fonts and colors to edit my materials in a style consistent with my branding. The in-built analytics and tracking tools helped me understand how students were using my materials.
This free alternative to Piktochart makes it easier to integrate multimedia files. I was able to upload pics, videos, and audio to create engaging presentations in this table chart maker. For instance, I used this software to promote my photos, create tutorials and infographics, and add voiceovers to my lectures to explain specific techniques.
Face-to-face comparison:
| Feature | Infogram | Piktochart |
|---|---|---|
|
Interactive visualizations
|
AI-powered charts, object animations |
Basic chart tools
|
|
Real-time collaboration
|
✔️ |
Limited
|
|
Template library
|
Extensive selection of various visuals |
Infographics templates |
|
Data integration
|
Import from Google Sheets and Excel |
Basic
|
|
Analytics features
|
Detailed engagement tracking
|
Basic
|
Pricing: free, from $19/month
Platforms: Web
Best for: Presenters, educators, and marketers needing quick, customizable clipart and slide visuals
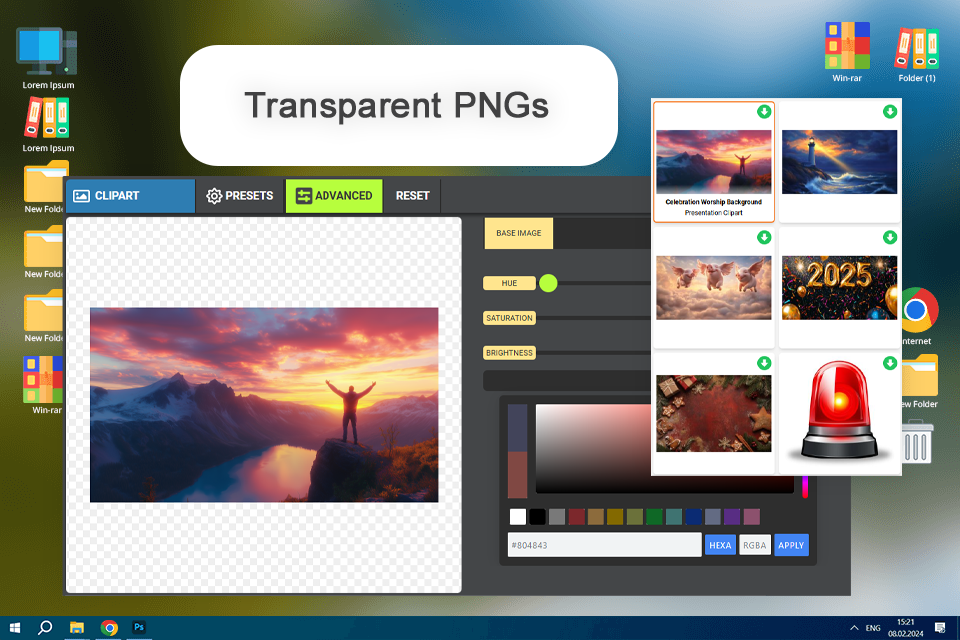
PresenterMedia was invaluable to me during the times I needed to have images instantly available for slide shows and blog posts. This Piktochart alternative offered me thousands of options of clipart to just drop into PowerPoint or save as PNGs for the web.
I mostly used their editable clipart to tailor seasonal images and business-related icons. The editing software gave me the option to embed text or change colors directly from the website, sparing time in cases where I did not want to open a third-party design software.
It was especially easy to create themed slide sets where I wanted to have uniform images. All I did was search by keyword, add some items, download, and drop them in my slides. Quick and easy.
Face-to-face comparison:
| Feature | Presentermedia | Piktochart |
|---|---|---|
|
Template variety
|
Slides & clipart
|
Infographics only
|
|
Multimedia support
|
Rich media
|
Limited
|
|
Image enhancement
|
Editable clipart
|
Basic tools
|
|
Video editing
|
✔️
|
Limited
|
|
Collaboration
|
Download only
|
Basic
|
Pricing: one month $39.95/month or unlimited $59.95/year
Platforms: Web
Best for: Individuals or small businesses for infographics and on-brand documents
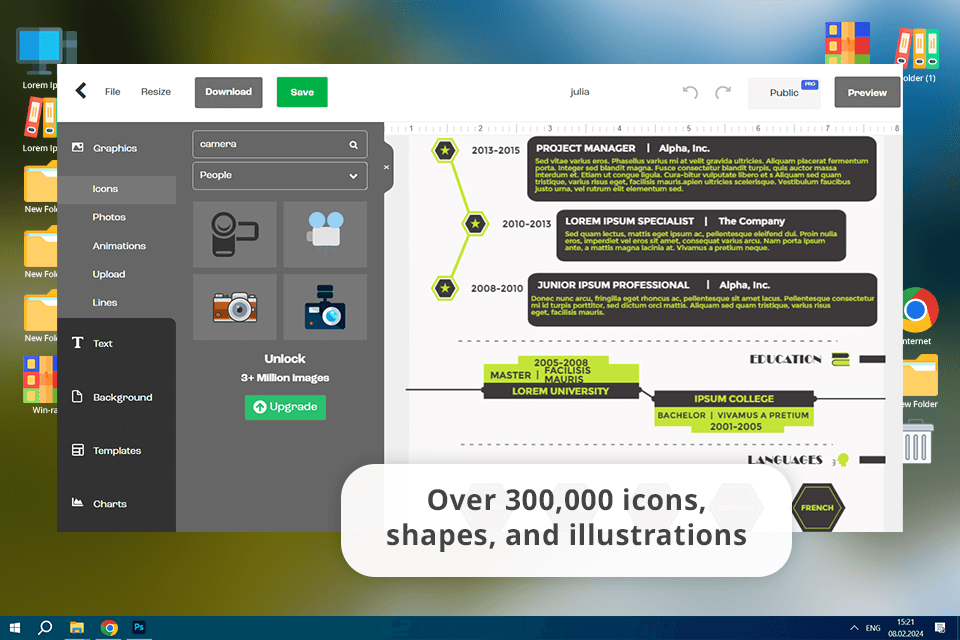
Easel.ly has an impressive choice of customizable templates suitable for creating infographics. I use them to clarify technical photography concepts like exposure triangles and lighting settings. I also like its collection of over 300,000 icons, shapes, and illustrations.
This free graphic design software makes it easier for users to add media files to their projects. I was able to upload pics and embed YouTube videos into my infographics to make it more illustrative. It was especially useful when I needed to provide a step-by-step guide or add my photos to illustrate some concepts.
In addition, I was able to use this Piktochart alternative free of charge to customize fonts and colors and maintain consistent branding throughout my photography course. The Pro account allows me to upload custom fonts. It was also easy to export my projects in different formats like PNG or PDF files to make my infographics more accessible for students.
Face-to-face comparison:
| Feature | Easel.ly | Piktochart |
|---|---|---|
|
Template library
|
Wide selection of templates |
Focuses on infographics
|
|
Data visualization tools
|
Basic charts and graphs
|
Advanced data visualization tools |
|
Collaboration features
|
Group accounts for students
|
Basic
|
|
Export options
|
PNG, PDF, online sharing
|
Various formats including HD export
|
|
Tutorials and support
|
Text-based and video tutorials
|
Comprehensive help center
|
Pricing: free, from $3/month or $24/year
Platforms: Web
Best for: Educators and marketers looking to create engaging animated content
When I decided to use Powtoon, I was pleased by the fact that it has dedicated tools for producing animated presentations. I used them to explain difficult concepts like lighting techniques and camera settings using animations. Another thing that I noticed is that this video presentation software has adjustable templates that are perfectly suitable for creating educational content.
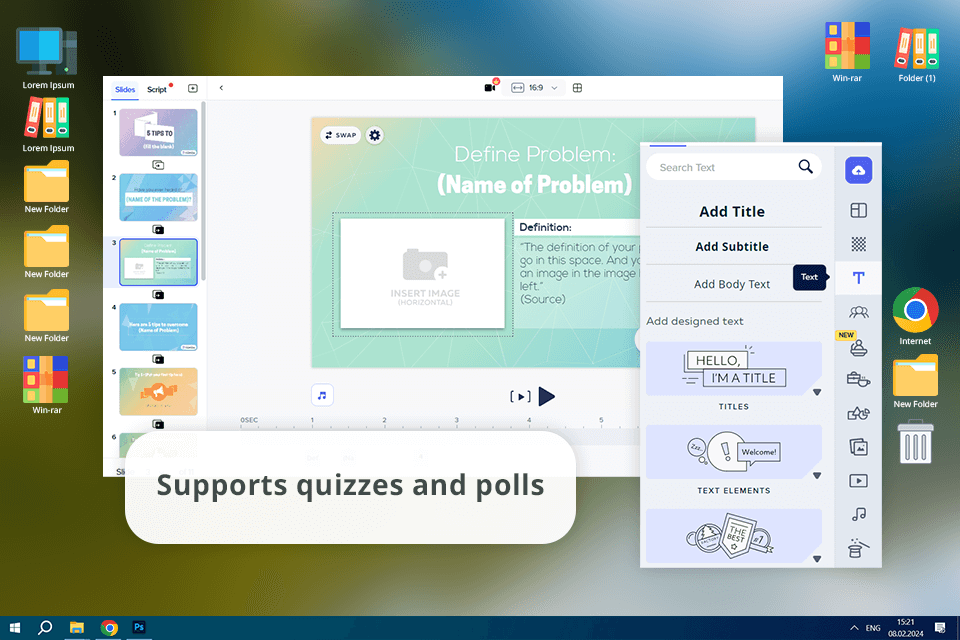
The key advantage of this software is that it supports the integration of multimedia. Using this Piktochart alternative Windows and macOS users can present their photos in the best light and provide examples of specific techniques to create a more immersive learning experience. Educators will especially like that it allows users to add polls and quizzes to presentations to make them more interactive.
Face-to-face comparison:
| Feature | Powtoon | Piktochart |
|---|---|---|
|
Primary focus |
Animated presentations and videos |
Infographics and static visuals |
|
Ease of Use
|
Intuitive drag-and-drop interface
|
Difficult to use for infographics
|
|
Template variety
|
Extensive library of animated templates
|
Customizable infographic templates
|
|
Customization options
|
High (animation and multimedia)
|
Moderate (static content customization)
|
|
Interactivity
|
Supports quizzes and polls |
Limited interactivity
|
Pricing: free, from $19/month
Platforms: Web, Windows, macOS
Best for: Educators and professionals needing engaging presentations
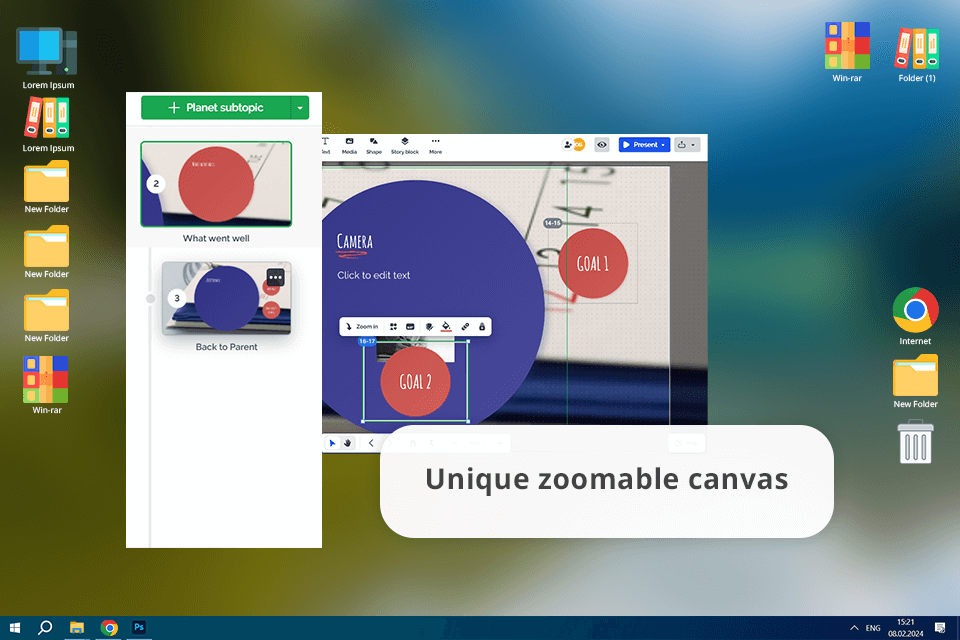
When I started to use Prezi, I was instantly captivated by its zoomable canvas. It makes it different from slide-by-slide presentation services and enables me to present my thoughts in a more engaging way. When creating photography courses, I like to demonstrate how different techniques and concepts are linked in a non-linear way.
Another advantage of this Piktochart alternative is that it enables me to give my projects a more dynamic feel by adding animations. I was able to demonstrate the process of editing an image step by step and help my students focus on every stage. This service integrates with Zoom, Google Meet, and Microsoft Teams, which allows me to use it during live sessions.
Face-to-face comparison:
| Feature | Prezi | Piktochart |
|---|---|---|
|
Presentation style
|
Interactive, zoomable canvas
|
Traditional slide-based format
|
|
Video integration
|
✔️ |
❌ |
|
User experience
|
Engaging and dynamic
|
Streamlined but less interactive
|
|
Templates
|
Extensive collection of artistic designs
|
Most of them are suitable for infographics |
|
Collaboration
|
Advanced collaboration tools
|
Limited
|
Pricing: free, from $7/month
Platforms: macOS, iOS
Best for: Apple users looking for a presentation tool
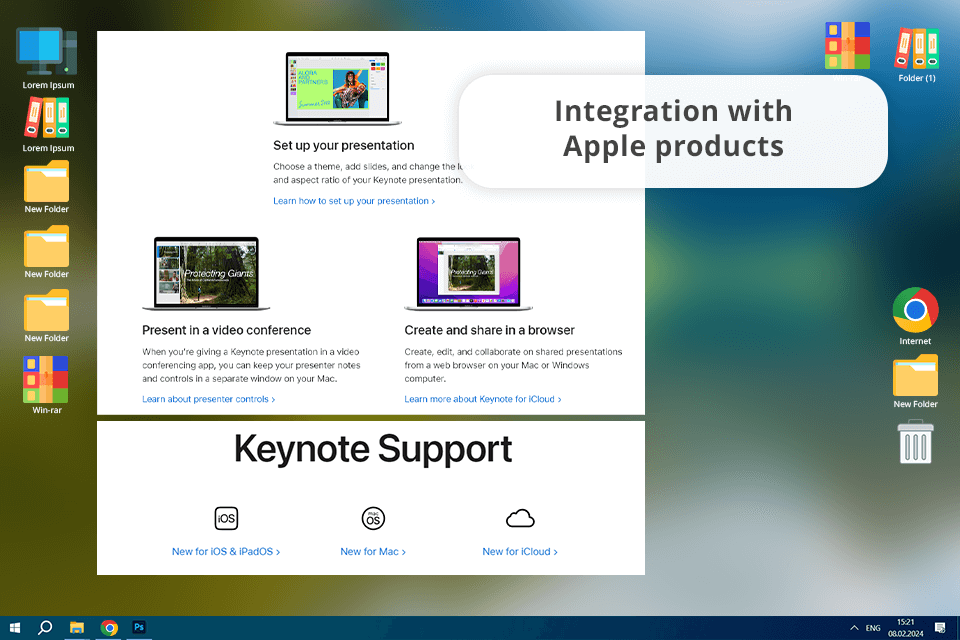
Keynote is an intuitive presentation and slideshow maker for Mac users. I was happy that I could customize the rehearsal display. It allowed me to adjust the settings of my presentation and set the right timing. While it may be less suitable for creating infographics than Piktochart, I can use it to produce attention-grabbing presentations with multimedia content.
Keynote has a collection of beautiful templates to choose from, which allows me to create nice slides without wasting a lot of time. I often use its graphic and animation tools. Keynote enables users to embed high-quality pictures, charts, and shapes to demonstrate how to use photography techniques and compositions.
Face-to-face comparison:
| Feature | Keynote | Piktochart |
|---|---|---|
|
Presentation style |
Interactive with engaging animations
|
Mostly for infographics
|
|
Multimedia integration |
Supports audio and video
|
Limited
|
|
Templates
|
Extensive collection of professional designs
|
Less artistic
|
|
Collaboration
|
Real-time via iCloud |
Basic
|
|
Accessibility
|
Offline editing possible
|
Cloud-based version only |
Pricing: free for Mac users
Platforms: Web, iOS, Android
Best for: Novice graphic designers for casual social media designs and sharing
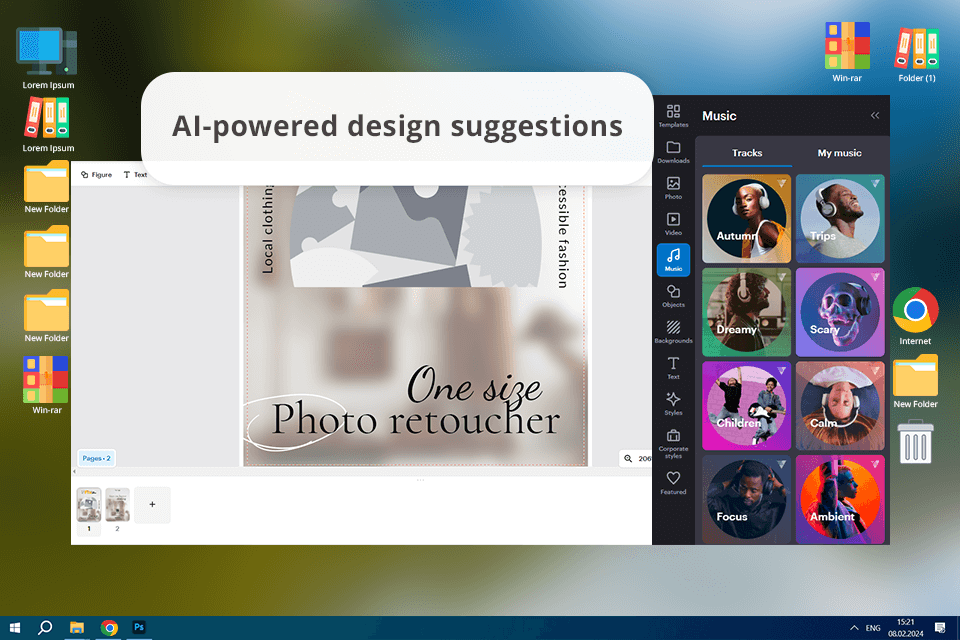
Thanks to its collection of over 50,000 templates, this app for creating flyers is an excellent choice for those who want to learn how to create pro-level photography presentations. The templates were created by dedicated professionals. They are suitable for creating social media posts, infographics, and presentations. I can change them so that they contain my branding elements and suit my style.
I was also impressed by AI-generated recommendations, which helped me choose suitable colors and layouts. This Piktochart alternative also has powerful video editing tools. Using them, I was able to add audio, animations, and text overlays to my videos. It helped me create dynamic content and produce engaging tutorials showcasing different photography techniques.
Face-to-face comparison:
| Feature | VistaCreate | Piktochart |
|---|---|---|
|
Template variety
|
A large library of customizable templates
|
Less focused on visual storytelling |
|
Multimedia support
|
Powerful video editing tools. Supports stock media integration
|
Limited
|
|
User experience |
Intuitive drag-and-drop interface
|
Traditional layout |
|
Collaboration |
Real-time |
Basic |
|
AI-powered features |
✔️ |
Limited |
Pricing: free, from $10/month or $120/year
Platforms: Web
Best for: Simple marketing collaterals and social media graphics
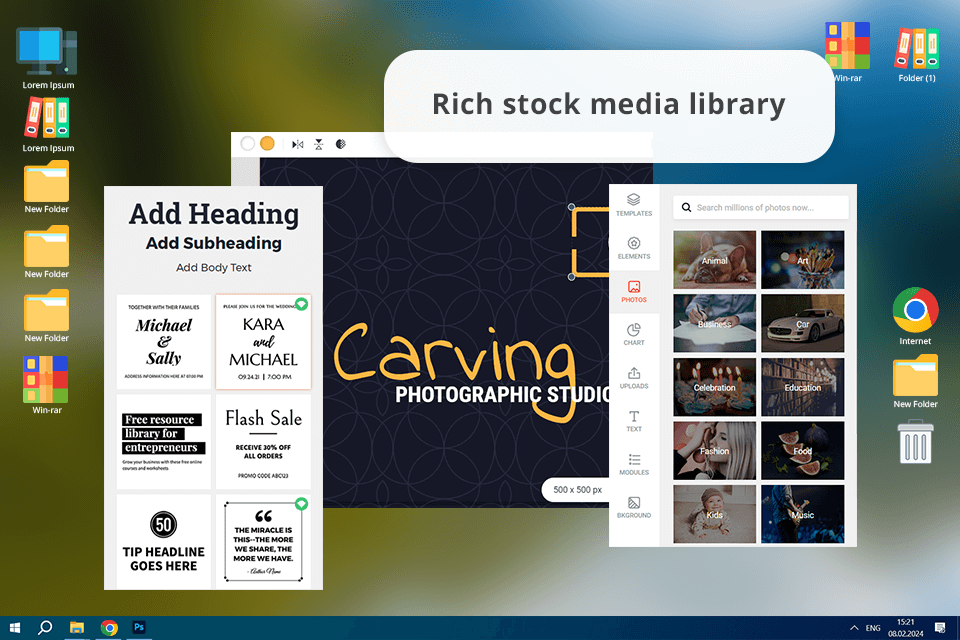
What I like the most about DesignCap is its huge collection of templates. It includes thousands of customizable assets organized in different categories. With them, I can create infographics, presentations, and visuals for social media. It allows me to create engaging materials that illustrate my photography lectures.
The editor is easy to use thanks to its drag-and-drop functionality. Even if you don’t have an extensive background in graphic design, you will master this software with ease. I like its customizable modules, as they helped me organize my media files and create well-structured layouts when working on my presentations. It makes it more convenient to use than Piktochart.
Face-to-face comparison:
| Feature | DesignCap | Piktochart |
|---|---|---|
|
Template variety |
Thousands of easy-to-customize templates |
Focused mostly on infographics
|
|
Multimedia support |
Large stock media library
|
Limited |
|
User experience |
Intuitive drag-and-drop UI
|
Classic infographic layout |
|
Collaboration
|
Basic sharing tools
|
Real-time collaboration tools
|
|
Chart creation
|
Various types of customizable charts
|
Powerful infographic-focused chart tools |
Pricing: free, from $4.99/month