Analyze large volumes of data and visualize it using graphs and charts with the best data visualization tools. Show off your results by creating dashboards, annual/quarterly reports, presentations, marketing or other business materials.
Turn tons of information and other content into simple graphs and showcase them to your sponsors or employees using one of the best data visualization tools.
The programs listed below can process massive data sets, analyze and output an array of charts, graphs and maps. With them, you can provide analysis and present your business metrics or your team’s schedule in visuals.
Verdict: Zoho Reports is an affordable self-service business intelligence tool with the ability to turn data into visuals. It offers dashboards, analysis, reporting, data storage, and more.
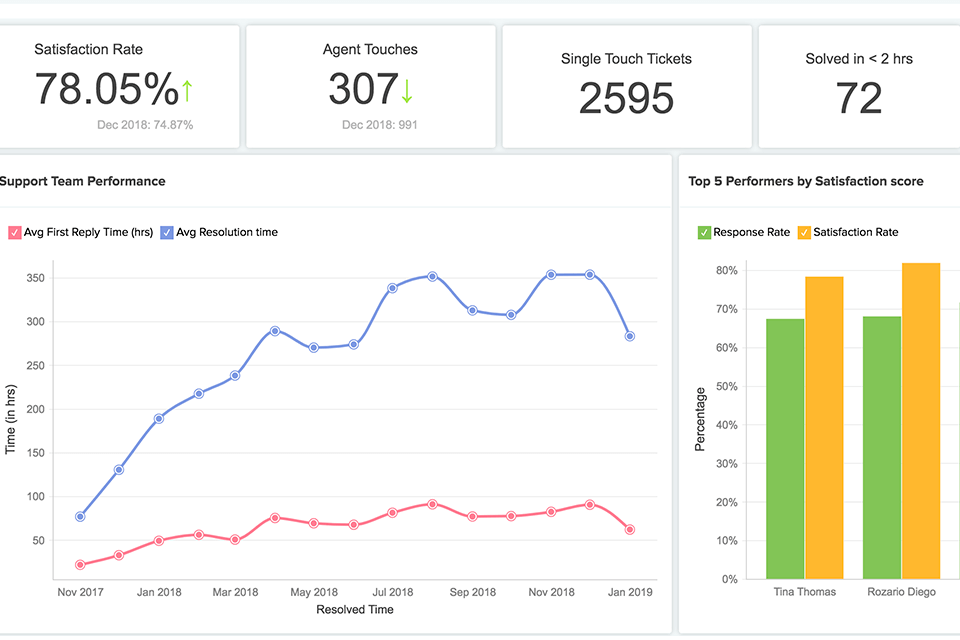
This data visualization tool includes various reports that allow for real-time tracking of multiple business activity aspects.
Also, Zoho Reports offers convenient charts and widgets. Team members can exchange data and work with tables and reports while using individual access controls, which allows you to replace third-party document management software.
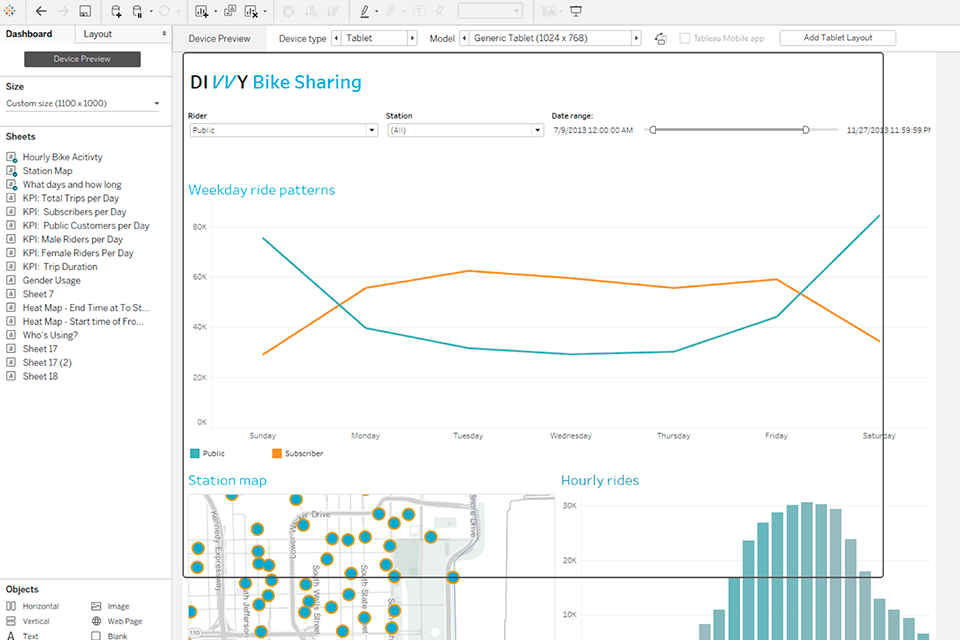
Verdict: Tableau offers an intuitive interface, an extensive library of infographics and top data visualization tools. The program features multiple data importing options. For example, you can import CSV files or use Tableau with Google Ads, Analytics and Salesforce.
Output options include multiple charts that come with various display options. This means designers can create color-coded maps that show geographically essential data in a format that is much easier to read than a table or chart.
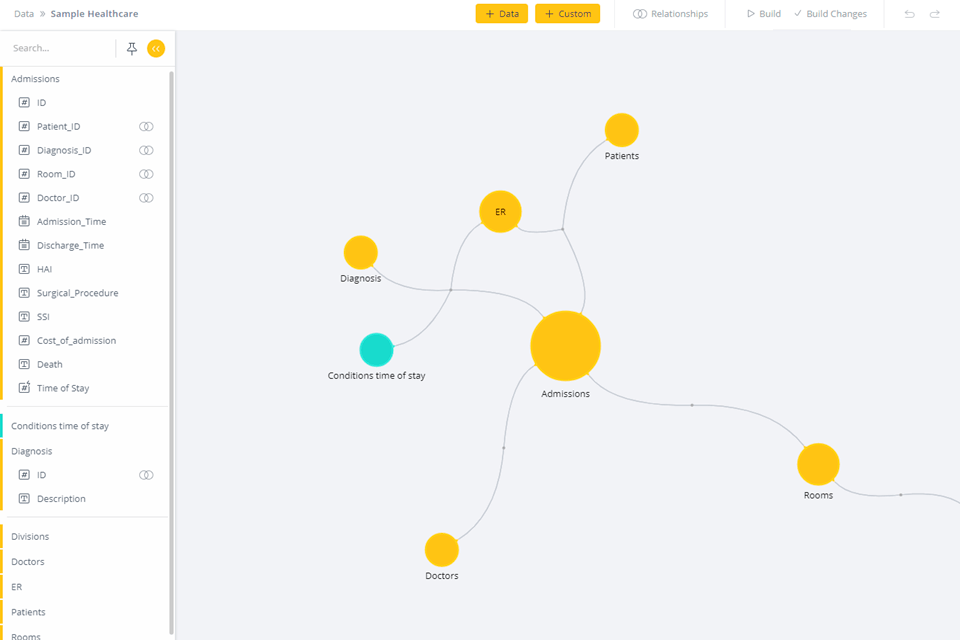
Verdict: Sisense allows you to get information from your collaborators in an instant. The app enables you to create visual dashboards and reports, identify trends and patterns in the markets, and make data-driven decisions.
Each department and user has their own dashboards that demonstrate real-time KPIs metrics. Moreover, Sisense is designed to solve various business-critical challenges. All business aspects, such as acquisition, production and implementation, include highly detailed information that you can analyze with one tap.
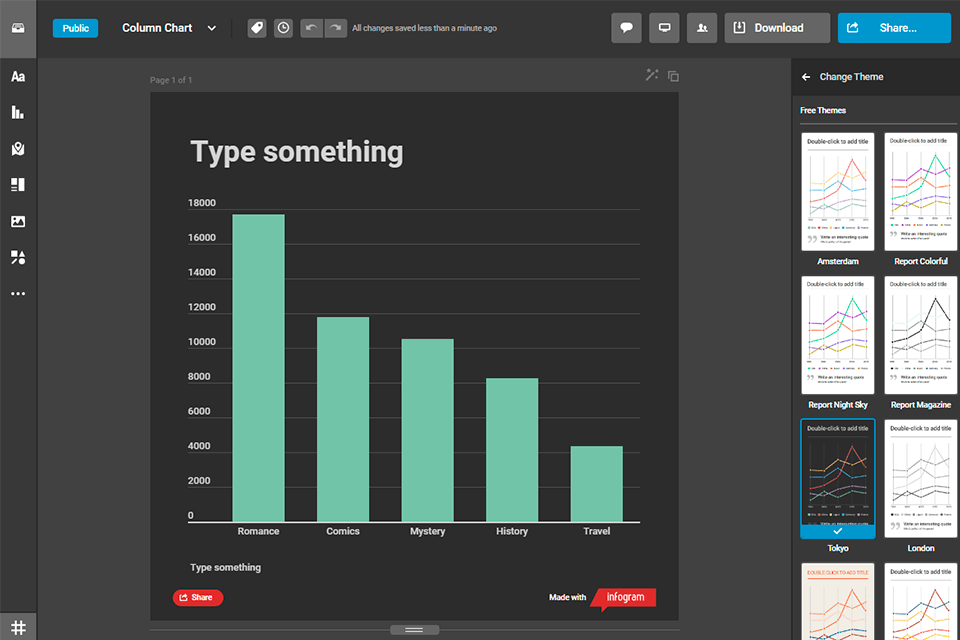
Verdict: Infogram is one of the best data visualization software solutions designed for business strategists, media companies and marketers. The app enables organizations to create a range of interactive data visualizations.
Infogram includes over 500 maps, 35 diagrams, 20 pre-installed templates, multiple icons, a drag-and-drop editor and data importing/exporting options. You can create infographics in HD quality in numerous file formats (PNG, JPG, PDF or GIF). Also, Infogram offers a WordPress plug-in.
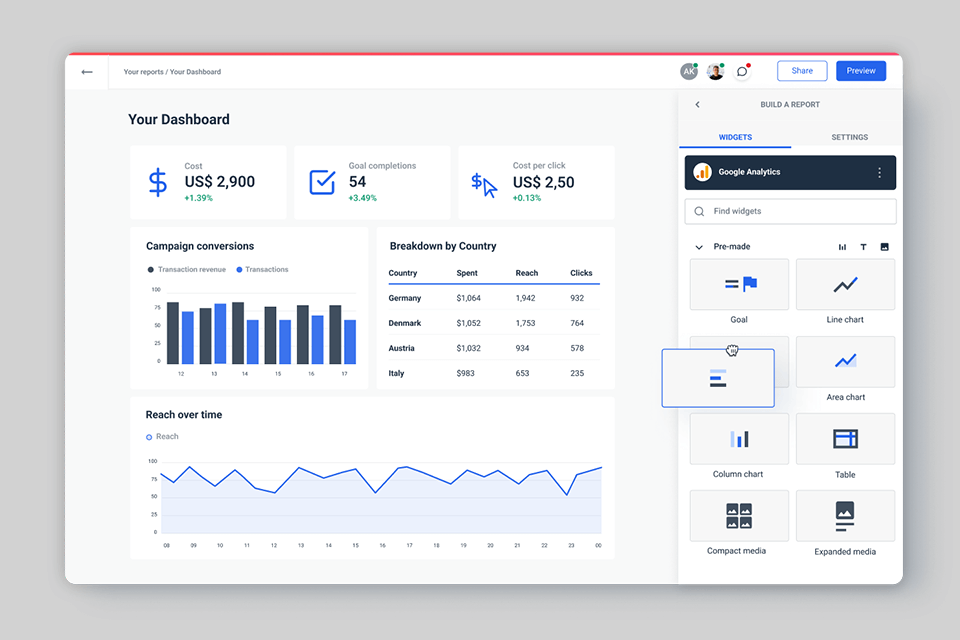
Verdict: Whatagraph stands out as a top-tier data visualization tool, simplifying the complex process of transforming raw numbers into impactful insights. Its intuitive interface empowers users to effortlessly create visually compelling reports. By offering a rich library of pre-made widgets and the flexibility to build custom ones, Whatagraph caters to diverse integration needs.
This tool excels in streamlining report creation, featuring quick chart and table generation, goal tracking, and seamless inclusion of ad images and social posts. It even empowers users with custom formulas for tailored metrics. With options to brand reports and link them to your domain, Whatagraph ensures a professional touch.
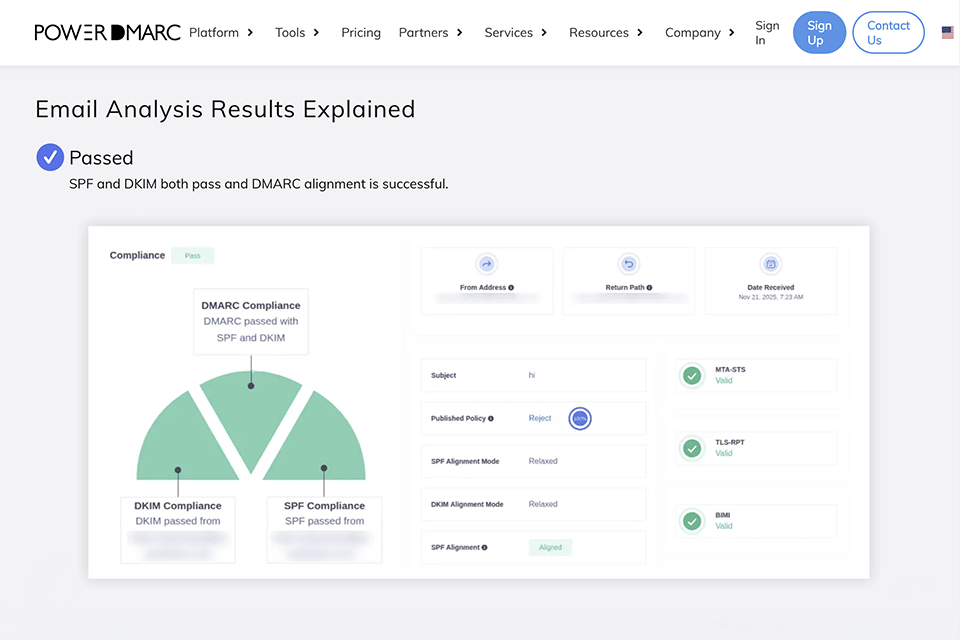
Verdict: I utilized this PowerDMARC to rapidly determine why an email was not arriving properly, and it provided unambiguous results in seconds. It functions as a data visualization tool, converting complex email headers into an understandable breakdown of SPF, DKIM, DMARC, and routing pathways.
What I enjoyed best was how simple everything was — no guesswork, just clear pass, fail, and risk indicators. It allowed me to quickly identify authentication issues and determine what needed to be fixed without having to go through raw header data.
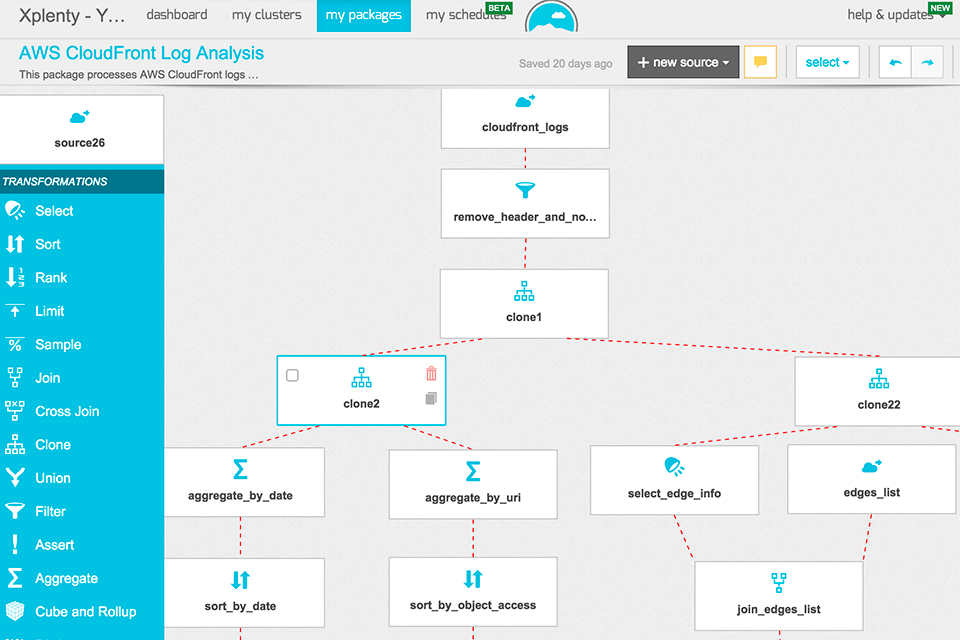
Verdict: Xplenty is a cloud-based data visualization platform. It can integrate information from over 100 data stores and SaaS apps. This is one of the best visualization tools that can process scheduling tasks, track job progress, display status and data selection.
The most distinctive features of Xplenty are metadata management, an ability to extract, transform, load (ETL), data preparation, pipeline design, job tracking, activity monitoring and data transformation. The platform also offers a dashboard and API that allows users to optimize and customize the platform according to their business requirements.
Verdict: Domo is a powerful business intelligence tool with many data connectors and effective data visualization capabilities. With APIs, Domo can collect both structured and unstructured data (like QuickBooks and social media) from local and cloud sources into a single visual unit.
Domo is a cloud-based service that offers analysis and visualization at both micro and macro levels. It supports an impressive set of plug-ins, such as R-tools, Informatica data management platforms, Microsoft Excel and Microsoft PowerPoint.
Verdict: Microsoft Power BI combines powerful analytics with an intuitive user interface (UI) and first-class data visualization techniques. It allows you to connect to 71+ data sources, which also include professional webinar software, create custom dashboards and detailed reports.
The service tracks important data of the organization and monitors information from all apps used by the company. Also, Microsoft Power BI provides tools for fast analysis, transforming and visualizing data, and sharing reports. The app offers SQL Server Analysis Services that enable users to quickly create reusable data models using shared datasets.
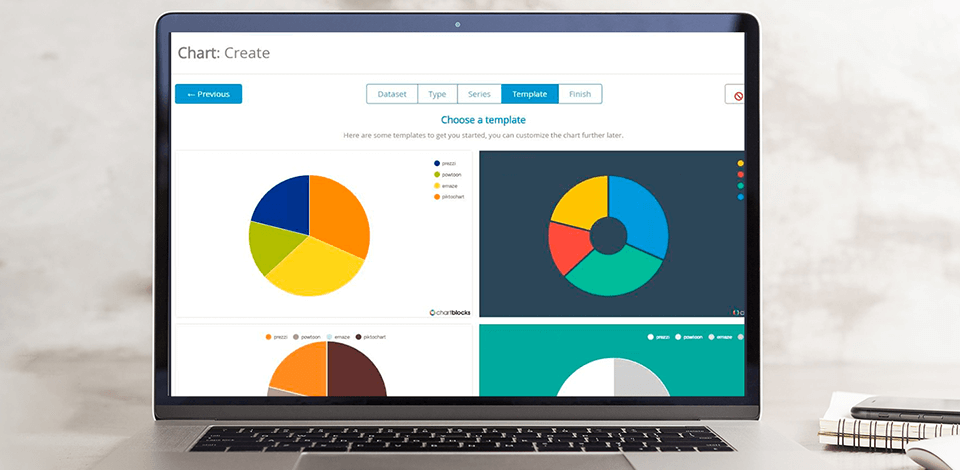
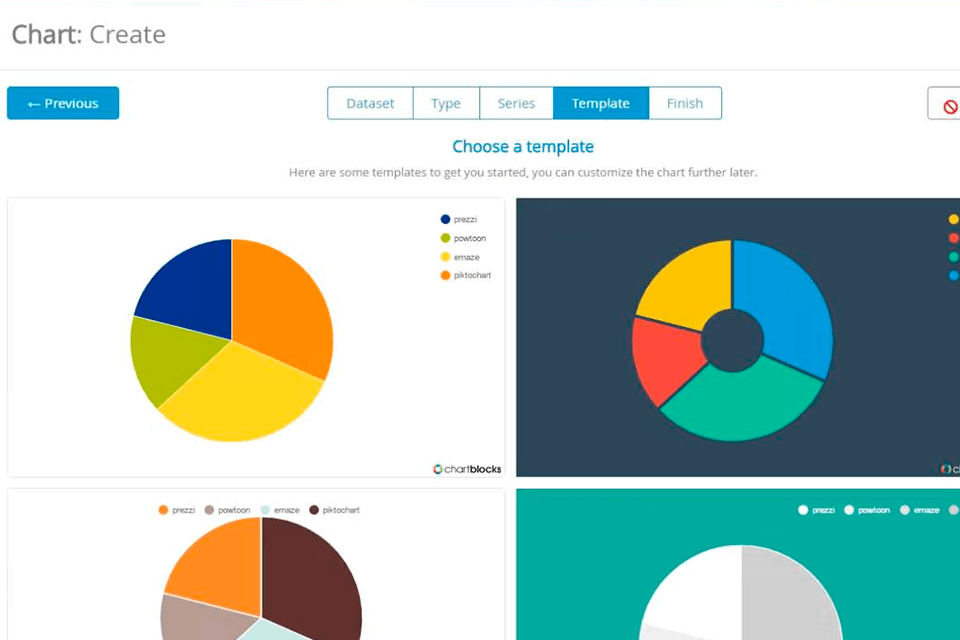
Verdict: Chartblocks is an easy to use data visualization tool that lets you create and publish charts and import them from spreadsheets and databases. You can import files from anywhere using API and live feeds.
The platform offers pre-designed templates with editable sizes, colors, fonts and grids. You can also use the D3.js library and save your customized charts as scalable vector graphics (SVG). Aside from supporting SVG files, this software can also save graphics in PNG, JPEG and PDF file formats.
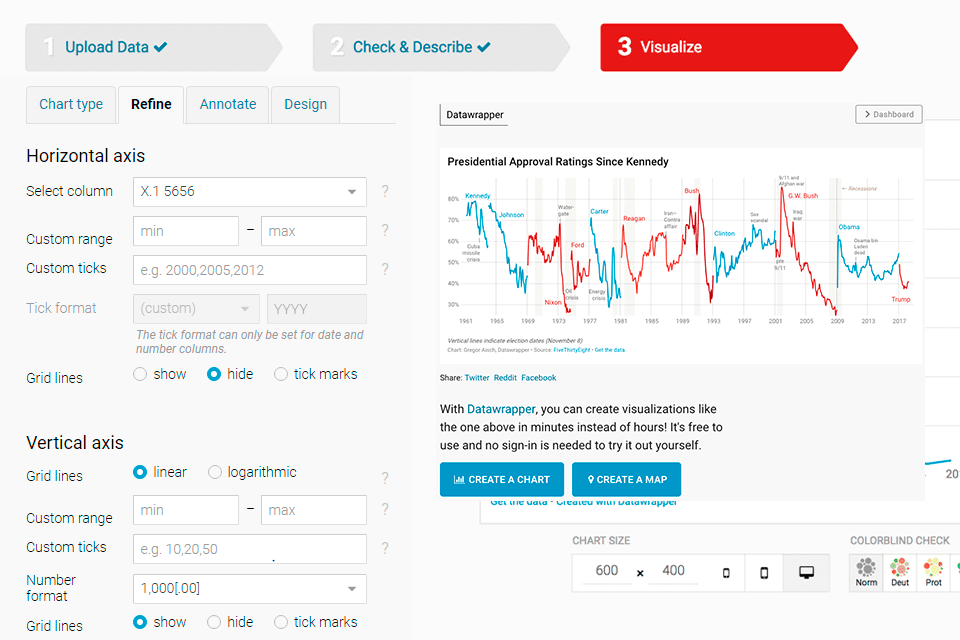
Verdict: Datawrapper is a data visualization service that is mainly used by journalists, developers and designers. It contains numerous interactive chart and map visualization tools that you can import on your website.
Datawrapper provides exceptional flexibility allowing you to create customized chart styles for specific purposes. The service has numerous bragging points, such as an ability to export projects to PNG or PDF, use maps, real-time chart updates, custom layouts and discrete colors. The platform allows you to transform data from web sources, CSV and PDF files into comprehensive charts without programming or design skills. You may also use such third-party services as Attention Insight to visualize AI heatmaps and improve your designs.
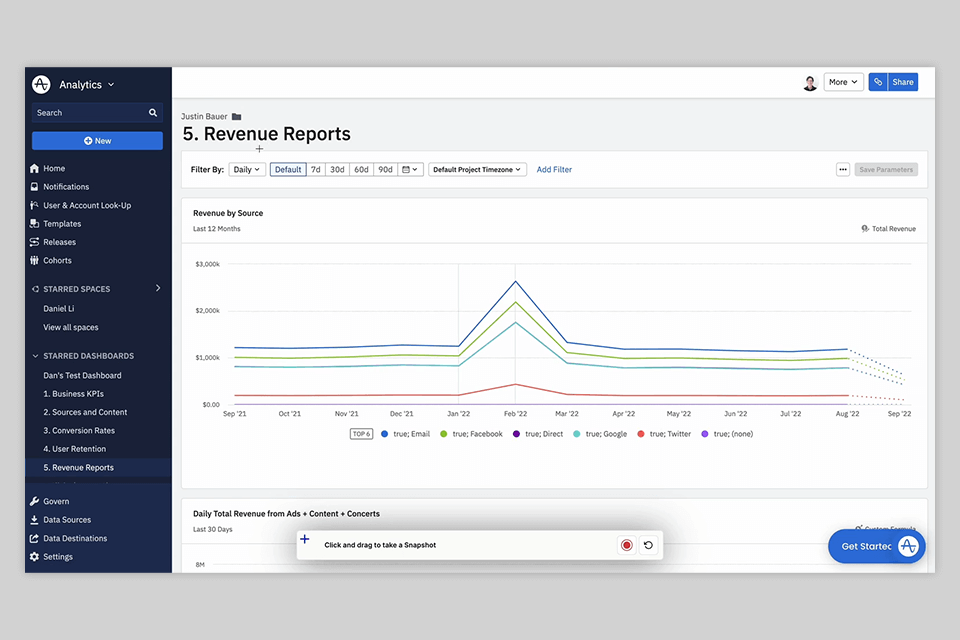
Verdict: Plus is one o the most convenient data visualization tools. It allows you to analyze multiple sources by comparing them side-by-side. Using Plus, you can easily take snapshots of websites and apps. It lets you share your snapshots with other people or import them into Slack, Google Slides, Canva, and other services.
It is the easiest way to work with your data without using third-party services with convoluted interfaces. Plus allows you to take a snapshot just as easily as you can take a screenshot. Besides, Plus keeps these snapshots up-to-date, which guarantees that you will always have access to the most recent data.