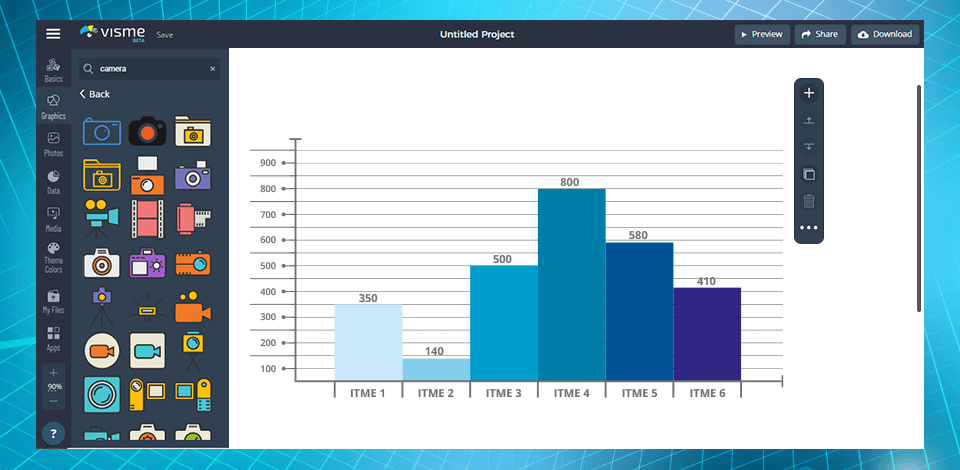
I have been working as a marketer at FixThePhoto for about seven years, and during this time I’ve tried 15 different tools, including Visme, for creating on-brand content from engaging presentations to docs, visual forms data visualizations, etc.
I've prepared this Visme review to help you decide whether this tool can satisfy even the most demanding marketer and whether it's worth spending your money on more expensive plans that start at $29/mo (if paid every month), or maybe you will be satisfied with a free version.
|
Supported platforms |
Web-based |
|
|
|
|
|
Supported file formats |
Images (PNG, JPEG, SVG), PDFs, PowerPoint files (PPTX), Excel sheets (XLSX), Word documents (DOCX) |
|
|
|
|
|
Graphic design tools |
A vast library of icons, and shapes for creating graphics and infographics |
|
|
|
|
|
Presentation creation |
Adjustable presentation templates with drag-and-drop functionality |
|
|
|
|
|
Data visualization |
Options for creating interactive charts, graphs, and maps |
|
|
|
|
|
Animation |
Basic animation features for adding movement and interactivity to designs |
|
|
|
|
|
Real-time collaboration |
✔️ |
|
|
|
|
|
Library of templates |
✔️ |
|
|
|
|
|
AI tools |
✔️ |
|
|
|
|
|
Regular updates |
✔️ |
|
|
|
|
|
Free version |
✔️ |
|
|
|
|
|
Mobile app |
❌ |
|
|
|
|
|
Best for |
Users who are looking for an intuitive and free tool for creating visual content without dealing with advanced video editing techniques |
|
|
|
|
As a marketer who often uses Visme, I consider their pricing structure to be reasonable and aligned with the value offered by the platform.
I also like that the platform has a free plan, which allows exploring basic features without spending a dime. Although I can't make certain that this version is the best one for employees, like me, who work in large companies, but for basic needs like creating a presentation or graphics for a school/university class, it's just fine.
I have been using a Pro plan for three years. I prefer this option because it allows collaboration with my colleagues, offers advanced privacy settings and such tools as charts, and data widgets, as well as the ability to create projects without the Visme logo.
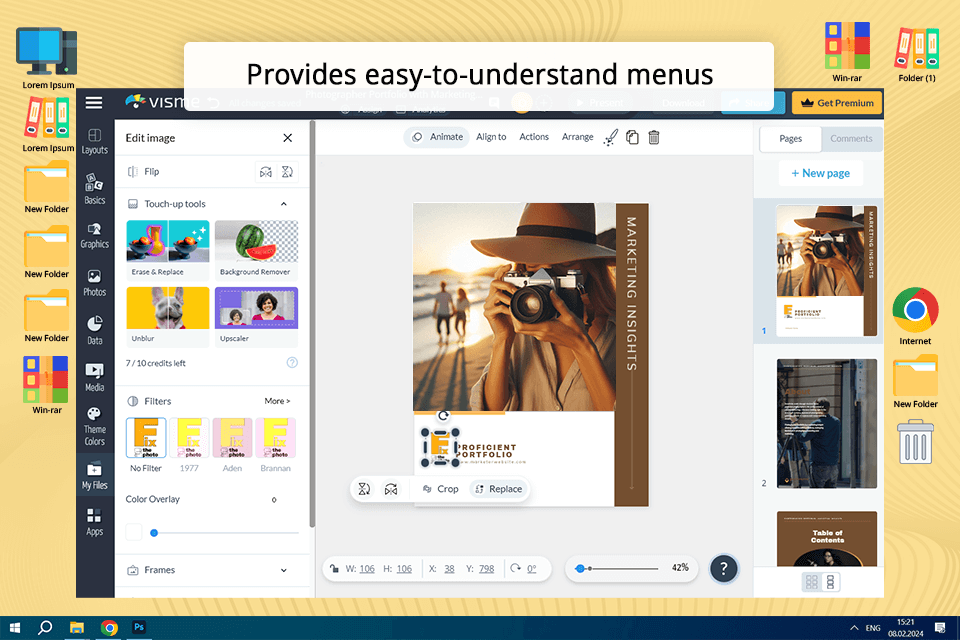
For me, the intuitive and straightforward interface of Visme is a considerable advantage. After logging in, a clean and well-organized dashboard, which is easy to navigate and use, appears. It is full of handy features and tools.
It also boasts a well-designed layout that includes easy-to-understand menus and icons that simplify the search for the needed function considerably. The interface remains smooth and consistent no matter what kind of job I’m trying to fulfill: create a presentation, design an infographic, or edit a video.
I also like that the interface is responsive and easy to operate. Whether I’m working on a desktop PC or a mobile device (although there is no dedicated mobile application), the UI remains lag-free, so the tool functions across different platforms without any issues.
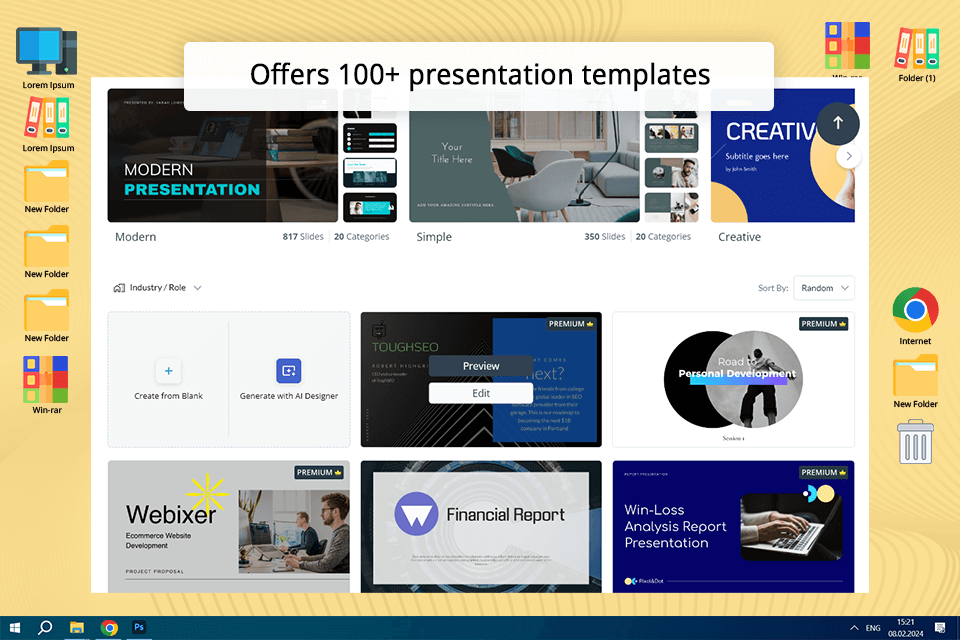
When I visit conferences or when I need to craft a presentation for a boss, I fully rely on Visme. Being one of the best Adobe Express alternatives, it offers 100+ presentation templates and themes with a clean, creative, and modern design. Customizable Visme presentation templates are ideal for different purposes: sharing, comparison, timeline, reports and charts, information, hierarchy, and instructions. You can choose templates based on keywords: anatomy, business, sales, etc.
If you need multiple presentations for different purposes with a similar look, themes are a perfect option for you. The classic theme of online slideshow maker includes 400+ slide layouts, and in a modern theme there are 900+ slide layouts that exactly match your presentation vision. You can create your own style by searching for graphics, photos, data, and media in the library, or by uploading your own content.
I have no trouble incorporating various assets like images, videos, or data from external sources into my projects. Extensive format support and integration with all well-known cloud storage like Google Drive, Dropbox, and OneDrive are among the advantages I must mention. This flexibility allows me to take assets from various sources and use them in my designs.
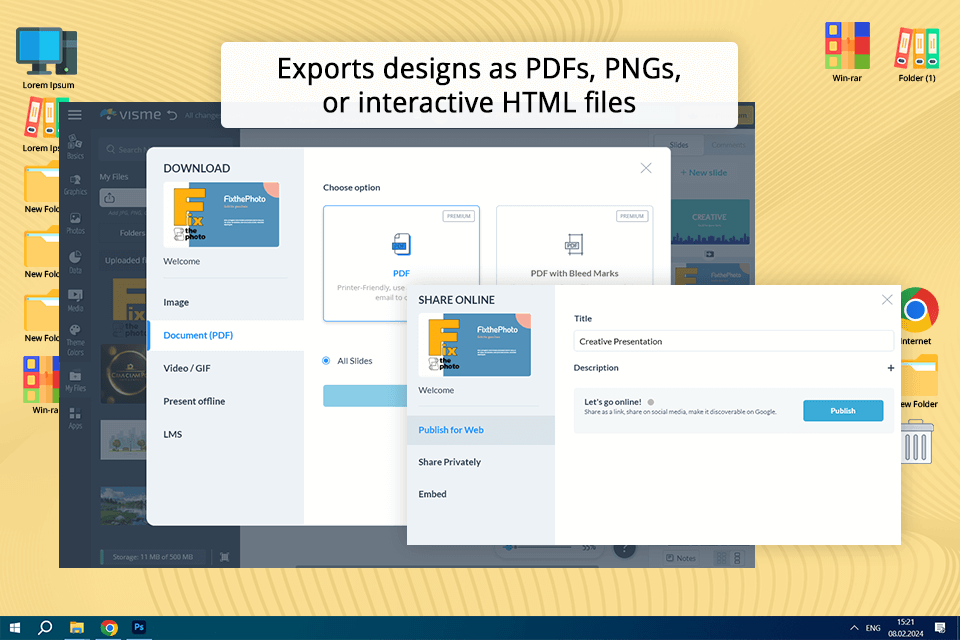
I was also glad to find out that the program allows sharing and distributing content through different channels in various formats like PDFs, PNGs, or interactive HTML files. Besides, no matter what format I prefer, I can be sure that the exporting process won’t spoil the integrity of my designs.
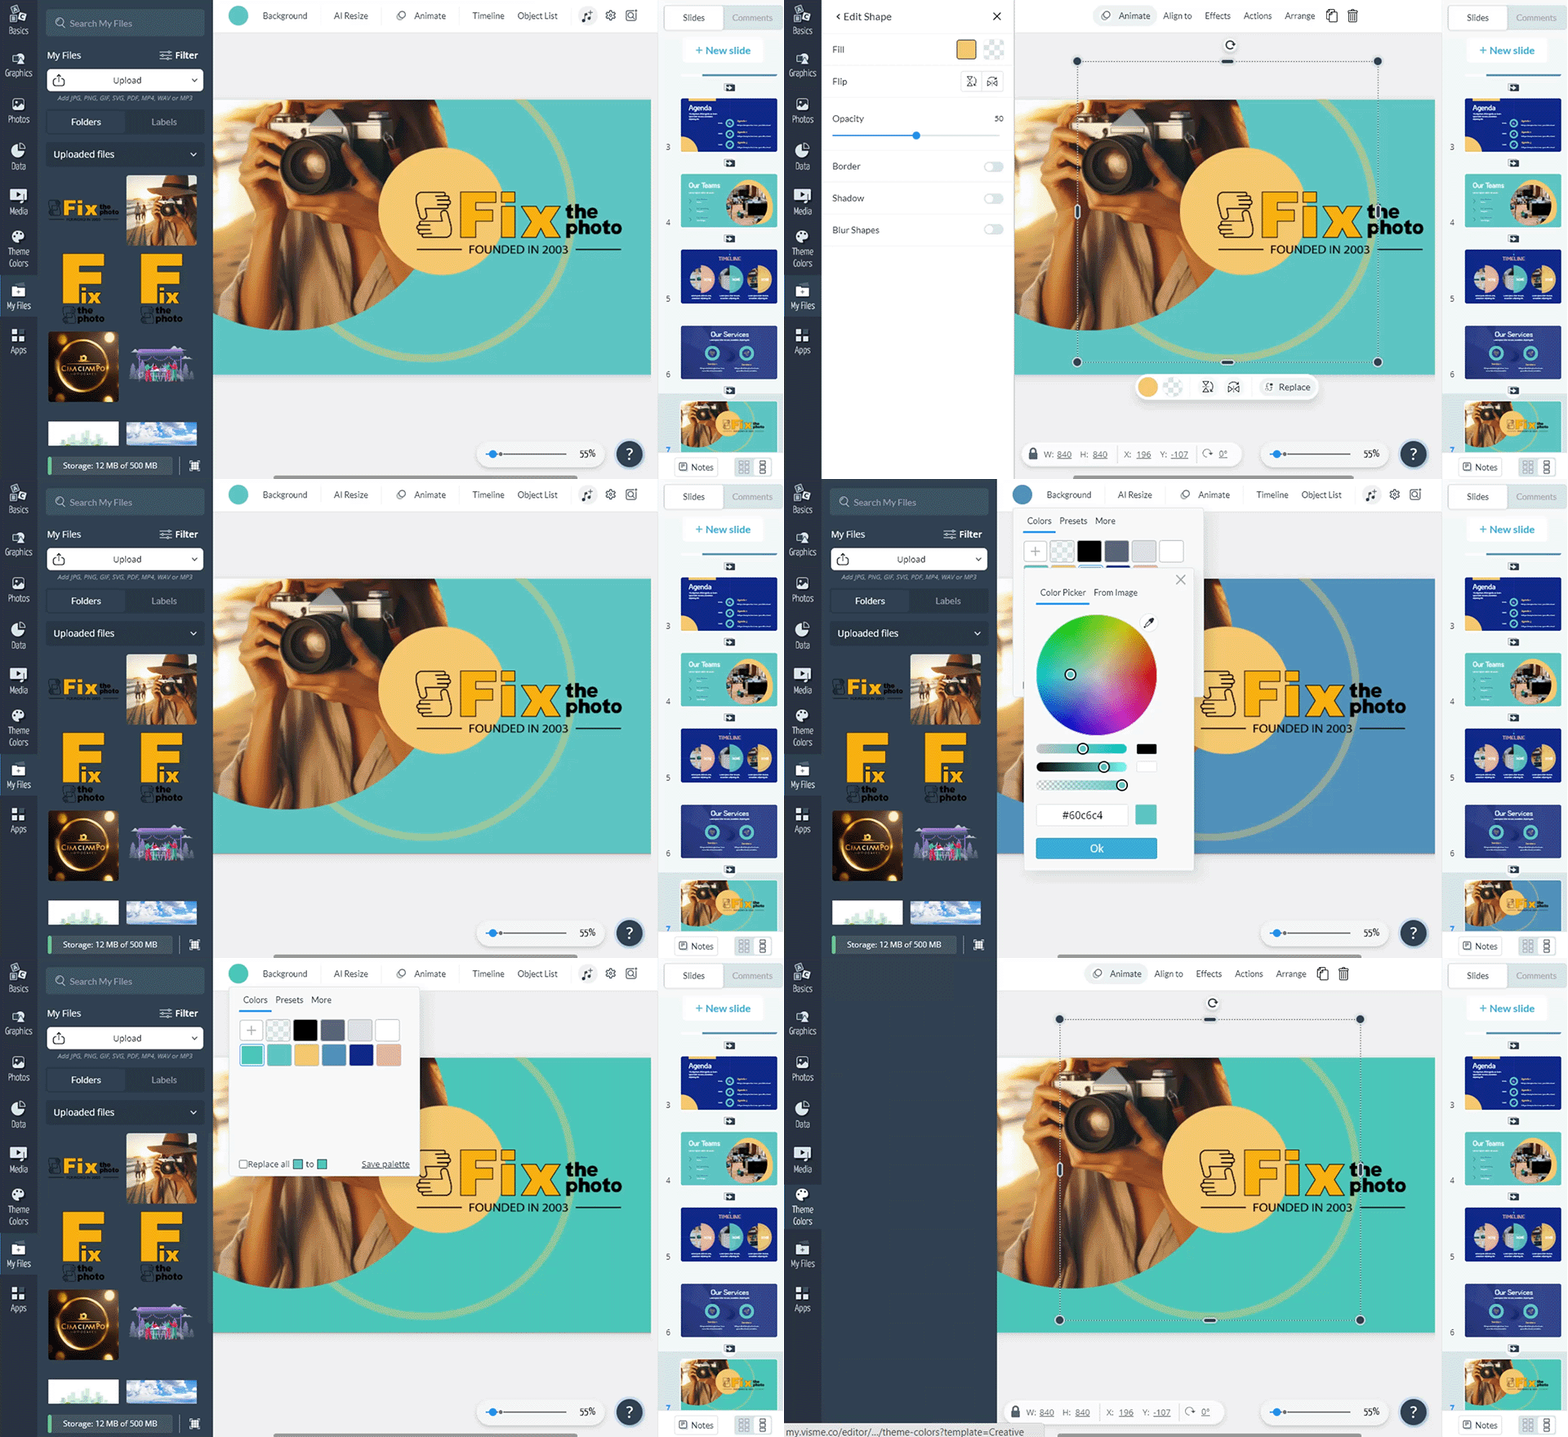
Along with a full set of graphic parameters – millions of embedded images, widgets, titles, fonts, icons, and backgrounds – there is an extensive toolset that lets you customize the published content to the desired extent. With these tools, it is easy to import third-party content and then edit it using the available templates.
You can also move elements back and forth, control transparency, and animate elements so that they appear in the field of view when you want them to. Instead of selecting a color with clicks, enter a hexadecimal code or adjust the brightness/darkness to find the desired one.
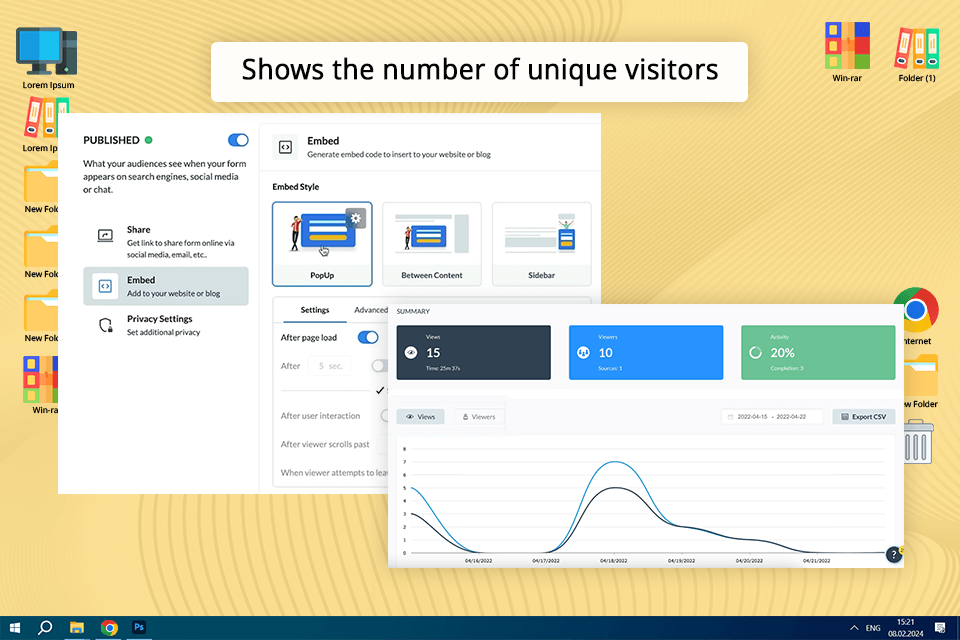
Often, I need to evaluate how appealing the published content is to make changes to webinars and other projects based on customer feedback and experience. Analytics helps me track the number of unique visitors, the most viewed content, and the time spent on the site by each user.
Moreover, I can upload this data as reports in Excel or as an interactive line graph based on an updated data table.
You can view the results in the toolbar and then upload data to the CRM or e-marketing platform.
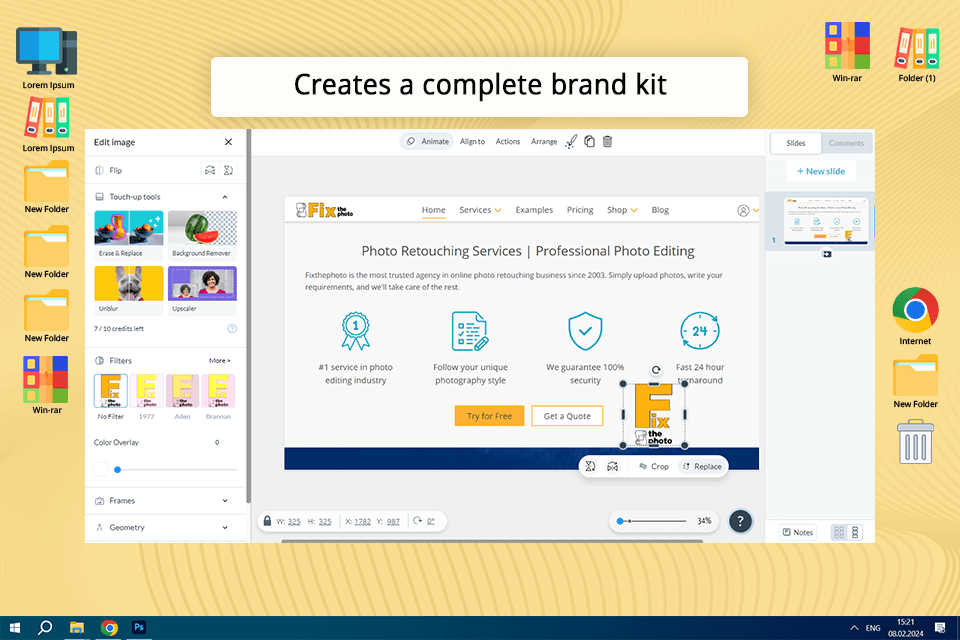
In Visme, you can create a complete brand kit in your business account: colors, fonts, logo, etc. Actually, this was the first thing I did after starting to work with the service.
The presentation is hosted on the Internet, so the selected fonts you have uploaded remain in place. You can import different color schemes and presentation design themes, and they will remain in the color selection list for easy access.
Your brand kit includes an area for adding templates that you often use for your business, various logo files, as well as quick-access links for your website and social media platforms. Another nice feature is the library of final slides that are often added to presentations.
Let’s say you created several presentations but changed your Twitter and Instagram IDs during the rebranding process. You don’t need to view each presentation to update this information.
Go to your slide library, correct the information there, and it will automatically replace the old markers in each of your presentations.
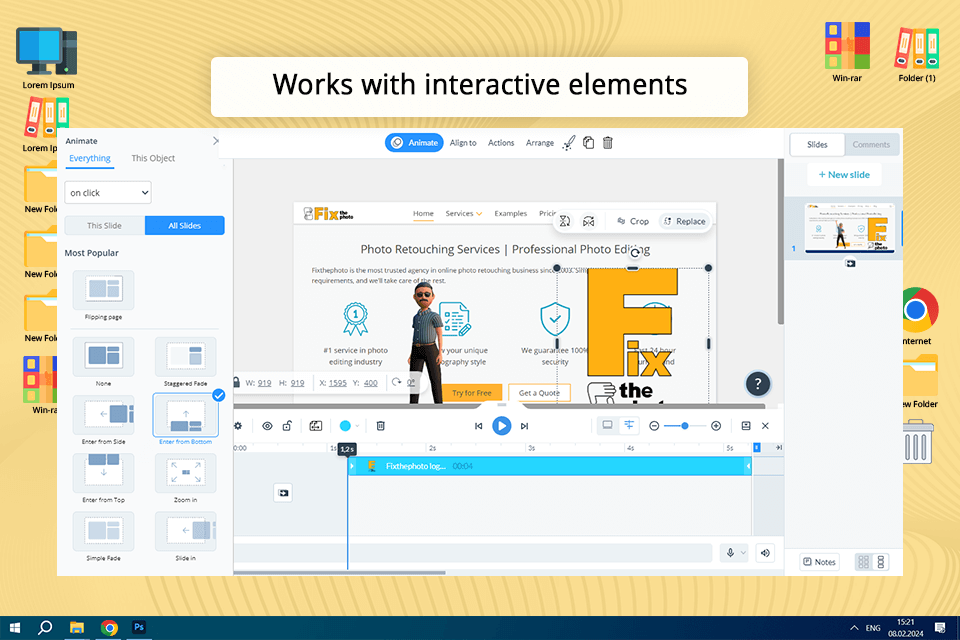
Whether you are hosting a live presentation or embedding a slideshow on a website, you can create links, call-to-action buttons, pop-ups, hover, move around the presentation, and add other interactive features that allow the audience to interact with the content.
Adding video/audio messages, and embedding online content in slides is easy without any workarounds. Besides, the program lets you upload an audio file or record audio directly to a slide.
Another feature I should mention is the ability to create interactive animated infographics. Visme is a great Canva alternative, so working in it you can create a unique infographic in a long format that changes as you scroll. To do this, export/publish it as an HTML5 infographic.
What’s impressive for me is the animated graphics that fall into three categories: illustrations, symbols, and gestures. Characters can be people dressed casually or professionally, mascots, or bots. Drag the character into your project and it will move and wave its arms.
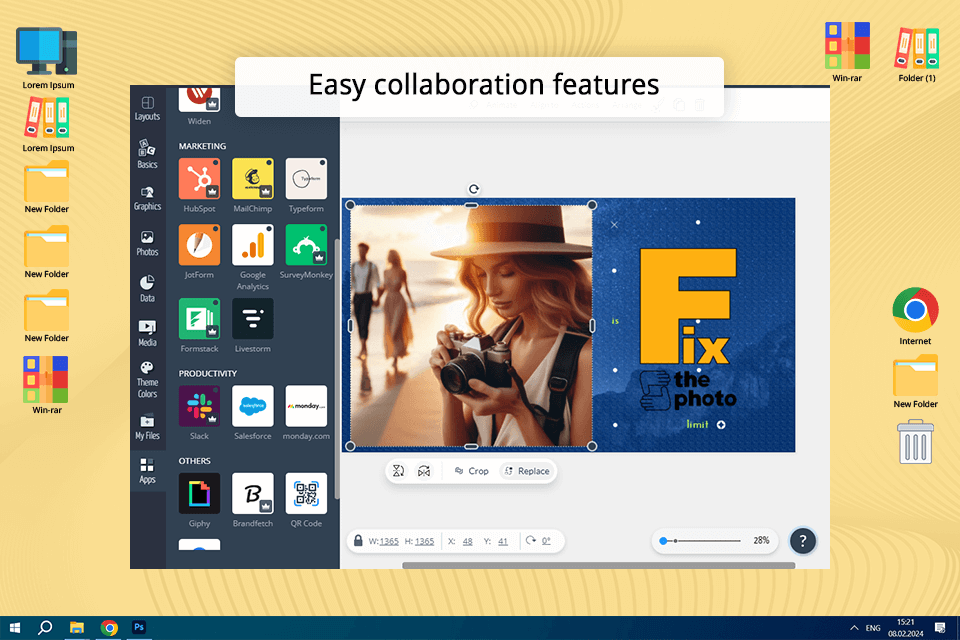
Similar to many Visme alternatives, the tool enables you to share content on social media platforms, publish content online on other sites, or make it private, embed it in the generated code on the site, or upload it for offline use in various formats.
Anyone who gets the URL can view the project as a website even without an account. Projects will be available for viewing on any device, and you can get analytics about views.
If you work in a team like me, you’ll benefit from the ability to send a presentation for editing, commenting, and viewing only. You can share it with specific people by name, email address, or group of people in your team settings. Setting user permissions is another handy option: grant editing access to a group of administrators and view-only access to a group of regular users in your team.
If you have created a presentation folder for a specific topic or report type, you can easily share it with your teammates. Besides, Visme offers an HTML5 download feature for offline presentations, which is useful when you are hosting a presentation in places where Wi-Fi access is restricted.
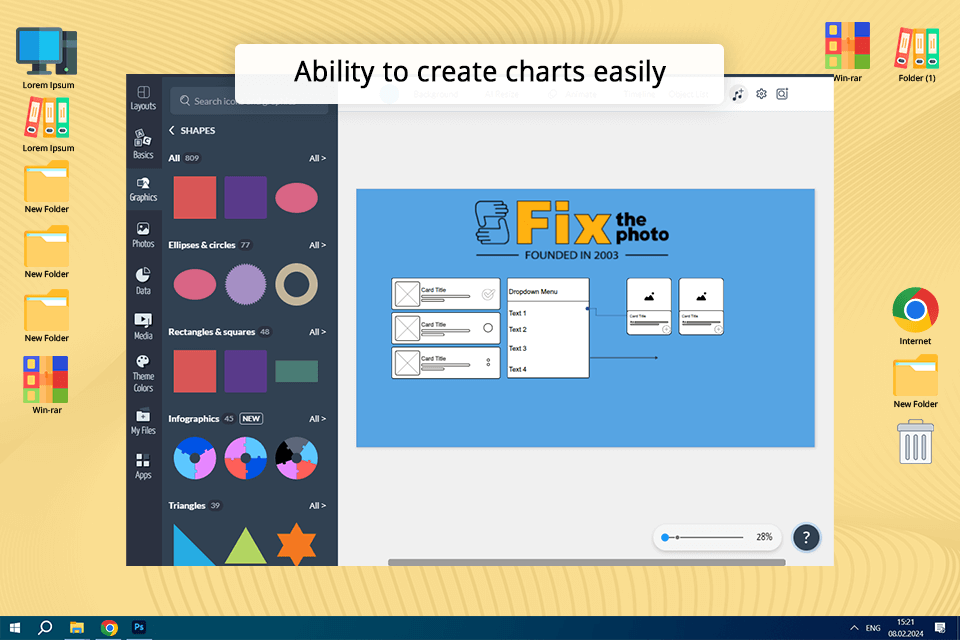
I often create charts and graphs in my presentation using this free infographic maker, as it allows presenting data in a visual way and offering a compelling argument to the audience.
Data visualization for transmitting research, statistics, and the latest news is very informative. You can start with a ready-made slide from one of the topics. There you will find radials, statistical views, thermometers, progress bars, histograms, line graphs, and more.
After selecting the tool, the Graph Engine will appear, letting you further customize the chart or graph. Add data manually to the provided area or import it from a Google or Excel spreadsheet. Then update the settings to customize the axis information and more.
Visme automatically animates individual chart elements to attract the attention of your audience. You can pick from four different chart animation options or disable it.
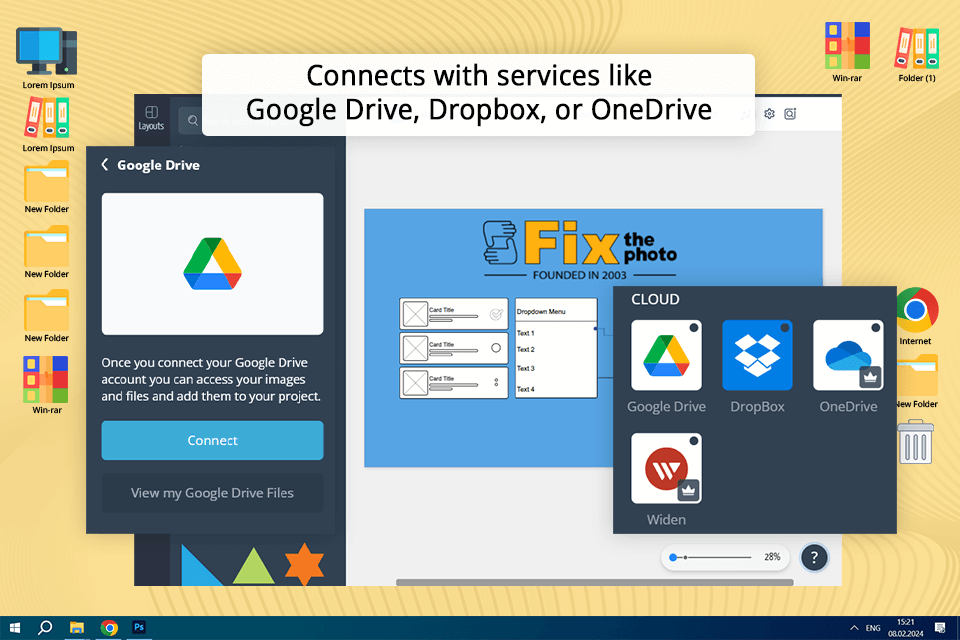
Another positive feature I should mention in the Visme review is the program’s ability to integrate with many other platforms. Thanks to it, I have no trouble accessing assets and data kept on other services, accelerating my workflow and boosting my productivity.
The list of Visme’s integrations also includes such well-known marketing tools as Google Analytics, HubSpot, Jotform, Mailchimp, SurveyMonkey, and Typeform, so I can make my designs more informative by adding valuable marketing insights to them.
In addition, it is possible to make my visual content even more eye-catching with multimedia elements taken from such platforms as YouTube, Vimeo, Wistia, Vidyard, or Loom. The connection to cloud storage services like Google Drive, Dropbox, or OneDrive provides me with access to any asset kept there. However, I am not permitted to host my projects there.
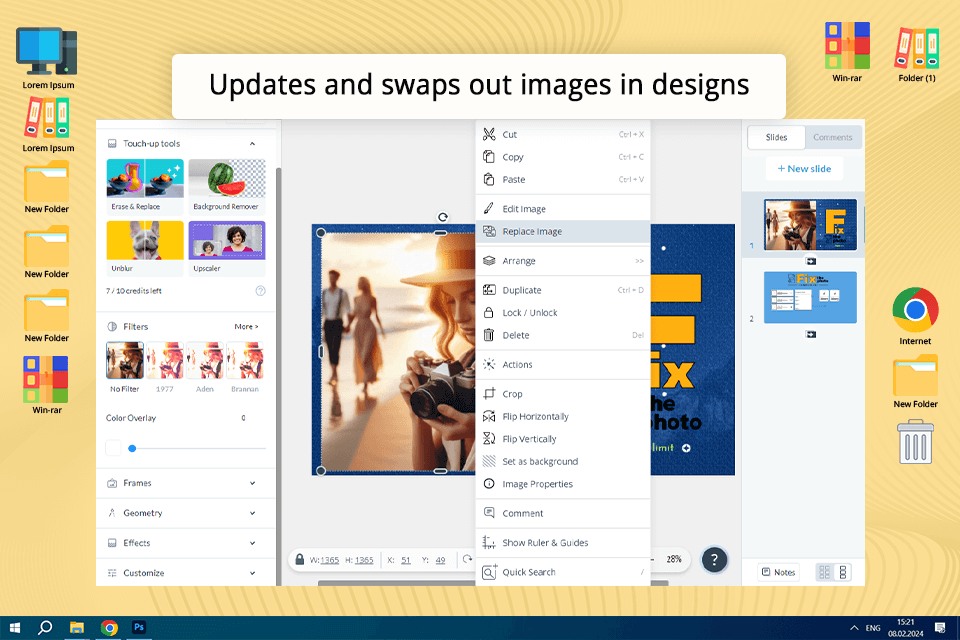
The developers of the service keep up to date, so they devote much attention to the AI tools in their latest updates. As I already wrote above, I actively use AI features to save time and get creative results.
For instance, there is the AI Designer tool that reviews my projects providing informative feedback about them. It also recommends the enhancements based on the design best practices to popularize my visual content for social media. Its AI Writer allows the creation of written content for presentations in no time.
Visme is one of the best data visualization tools, with which you can easily create virtually any type of visual content you need. This list includes presentations infographics, reports, posters, flyers, social media graphics, charts, graphs, maps, and more. Plus, the tool comes with a huge selection of customizable templates to make the workflow easier and more efficient.
Yes, Visme has a free plan but its functionality is quite restrictive. However, it allows users to try basic features for creating visual content. As for the advanced capabilities like collaboration, analytics, and premium templates, they can be only accessed after upgrading to a paid plan.
The program offers multiple collaboration options allowing teammates to work together on the designs in real-time. But keep in mind that collaborative capabilities become available only after purchasing either the Pro or Enterprise plan.
Yes, the tool allows users to tailor the projects to create a perfect representation of their brand identity and style. Each element of the design is easy to customize: be it a template, font, color, image, or other asset. So, generating amazing and cohesive content with the program is a no-brainer.
Yes, users can jazz up their projects with eye-grabbing multimedia elements like images, videos, audio clips, animations, etc. This is a sure and most effective way to make the content more engaging and deliver its message more effectively.
Visme offers robust analytics and tracking capabilities to define the most trending content and analyze audience engagement and behavior. To evaluate the popularity of their content and optimize their marketing strategies, users can see the number of views, clicks, and interactions.
The variety of export options is one of the greatest pluses of the platform. You can download projects as PDFs, PNGs, or interactive HTML files. In addition, users can benefit from the variety of sharing options that allow posting content right on a social media platform or elsewhere.
Working as a marketer at FixThePhoto for seven years, I've tried around 15 different chart, diagram, and brochure makers for Mac and Windows, and I can say, for sure, that Visme is perfect for my tasks at this stage.
It appeals to marketers and content creators with an extensive library of templates, robust data visualization options, etc. Moreover, the tool is extremely convenient and efficient because of flexible export/import features and AI-powered tools.
However, some limitations of Visme may really disappoint you. For example, lower-tier packages lack collaboration features, whereas a free version only has limited functionality. Also, I cannot say that an ordinary user who needs to periodically create presentations and graphics must necessarily buy a subscription. In this case, I would rather pay attention to basic Microsoft PowerPoint and Google Slides.
But, if you work in a large team that creates a lot of visual content for your ads or blog articles, or you are a professional designer, this tool is a must-have for you.