Even if you have zero design experience, the infographic generators make it a breeze to create stunning designs. You can choose from various templates, color palettes, and text styles to create a visually appealing infographic that aligns perfectly with your content. Plus, these tools often come with a library of icons, illustrations, charts, and maps that you can use to make your infographic even more informative and eye-catching.
Look for an infographic maker that offers a wide selection of templates, as well as design tools that allow for customization. Along with this, you may want a data visualization tool that allows you to effortlessly create professional-looking infographics without any hassle. I also recommend to look for an infographic generator that offers social media links or easy sharing options so you can promote your infographics on various platforms.
★★★★★ (5/5) For social media
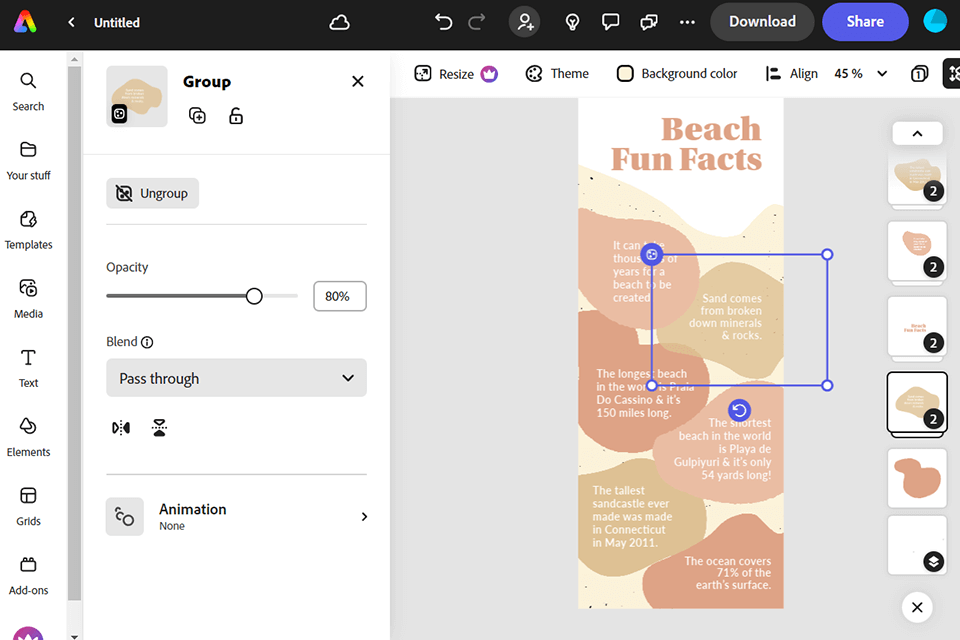
Verdict: Adobe Express is perfect for those who need to create visual content for social networks quickly and easily. This is the best free infographic maker as it offers over 10,000 templates and various free content like fonts, layouts, and filters, which you can use to create nice designs.
Adobe Express is very simple to use as it has a drag-and-drop function. All you have to do is to find a template and edit it. Using this software, you can adjust the background, and add text, photos, and various images, such as logos.
Compare Adobe Express vs. Photoshop, you’ll see that the second program doesn’t have a free version, while Adobe Express has it. However, to gain access to all features, you need a subscription. You can use this online interactive infographic maker on a mobile phone and connect it with many other Adobe software.
★★★★☆ (4.5/5) For beginners
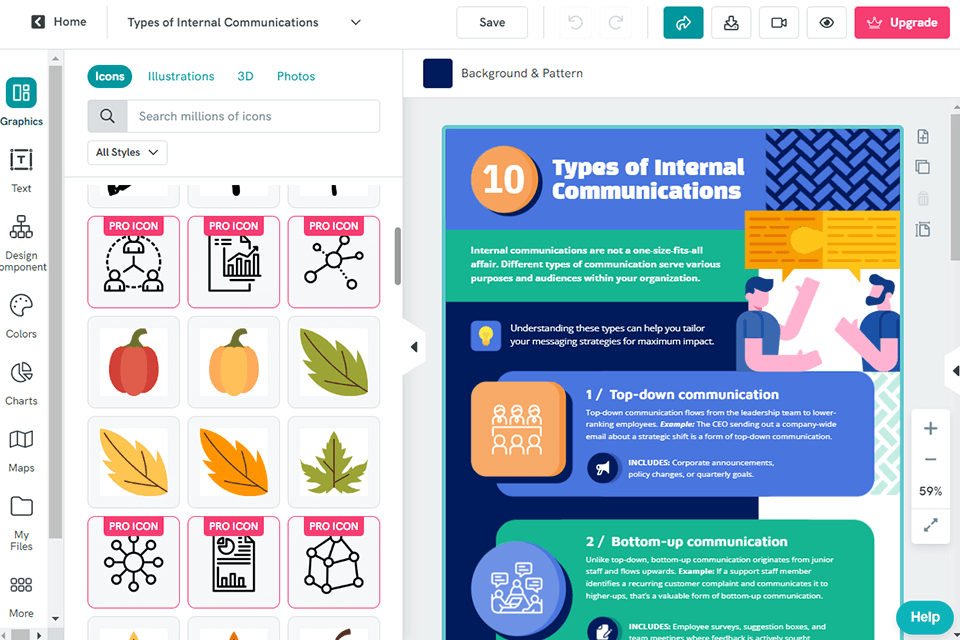
Verdict: With Piktochart you can create engaging and visually appealing infographics without spending a dime. This content creation app has a large library of free templates, including charts, maps, and other data visualization tools.
Piktochart allows you to personalize your infographic by adding your own text, fonts, and colors. It also provides millions of files, icons, illustrations, and photo frames to choose from. The online infographic maker offers a free version with limited features and a watermark, while the Pro version includes unlimited downloads and access to branding assets.
★★★★☆ (4.5/5) Pre-made assets
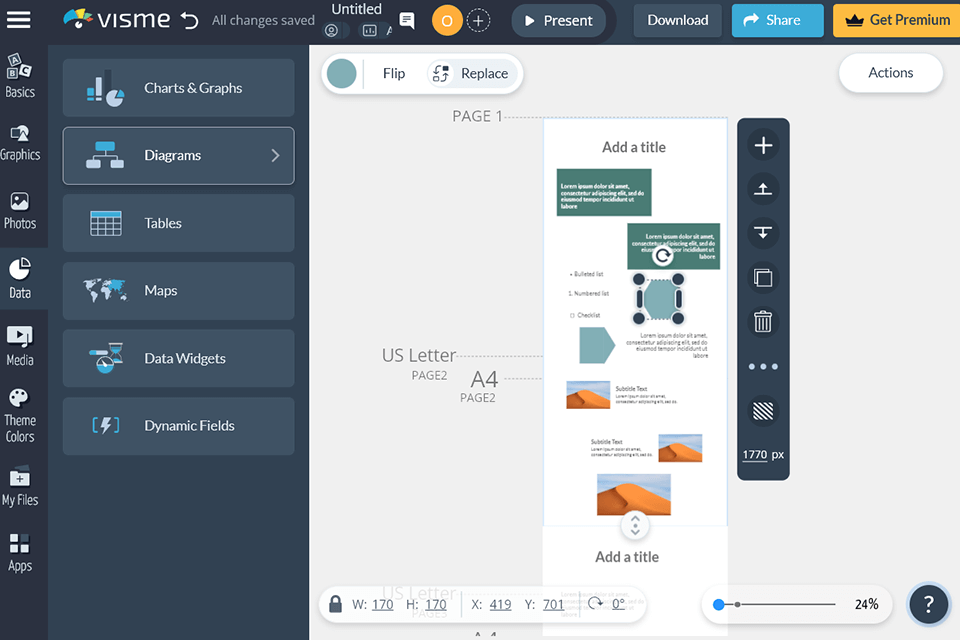
Verdict: Visme offers a wide range of customizable templates, making it easy to create professional-looking infographics. The platform also has a vast library of stock photographs, which is great for finding the perfect visuals for your designs. You can even add clickable elements to your projects.
This free infographic maker also supports multiple file formats and allows you to upload your own images. The free Visme version does have some limitations, so if you're looking for more functionality, you might want to consider upgrading. It offers different subscription options starting at $29 per month for a Starter account.
★★★★☆ (4.5/5) For business
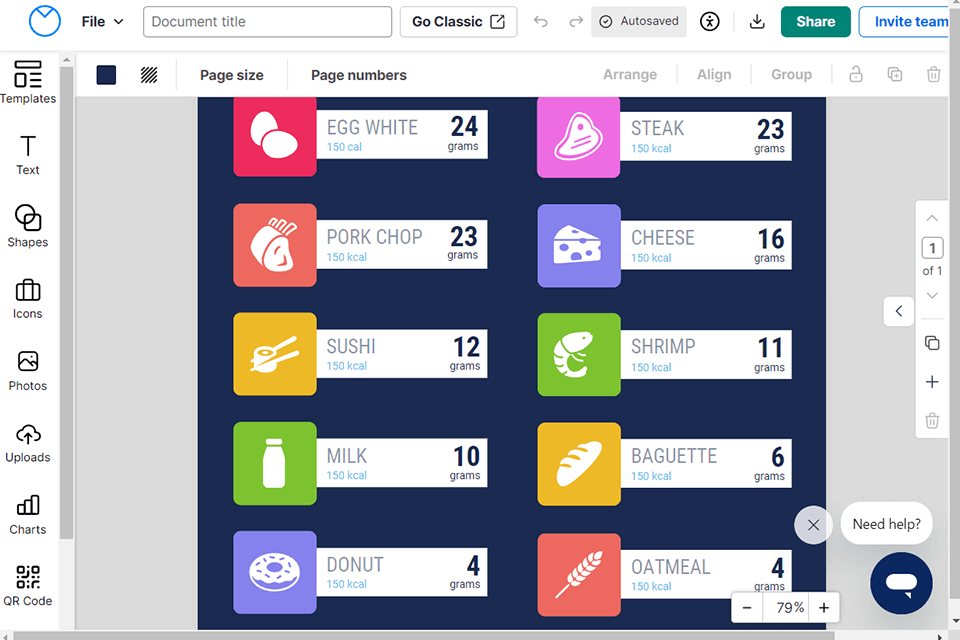
Verdict: Venngage infographic maker provides a lot of free templates, fonts, charts, icons, and ready-made samples. They are fully adjustable as the software offers all the necessary tools for editing templates, such as size, images, color, text, opacity, and many more. You can also add your brand logo, typeface or taglines.
The free version of the tool has a lot to offer, including customizable icons and images and support for multiple file formats. But for those looking for more advanced features and access to a larger selection of templates, there are paid plans available from $19/mo.
★★★★☆ (4.5/5) For data visualization
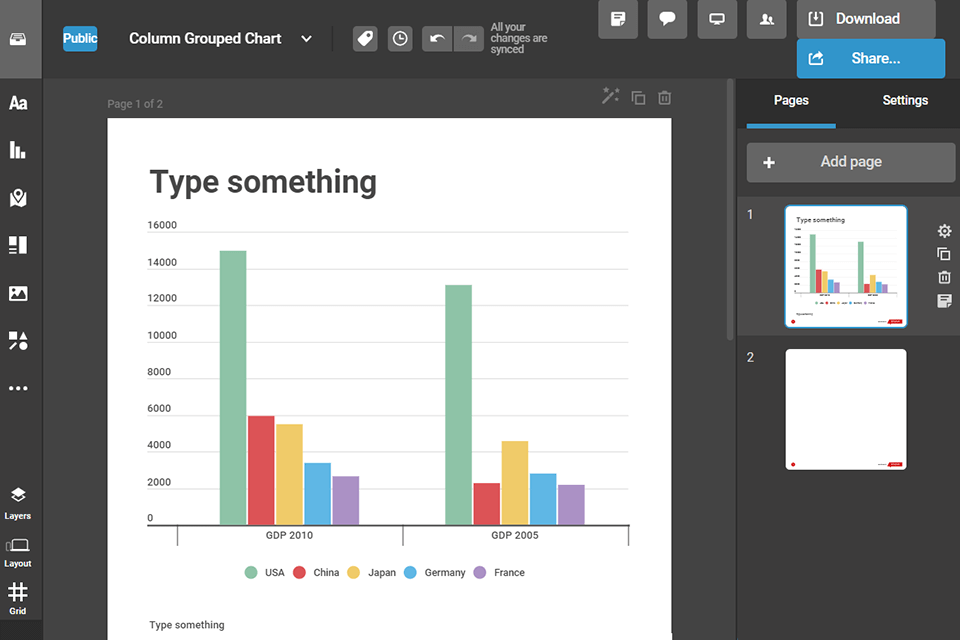
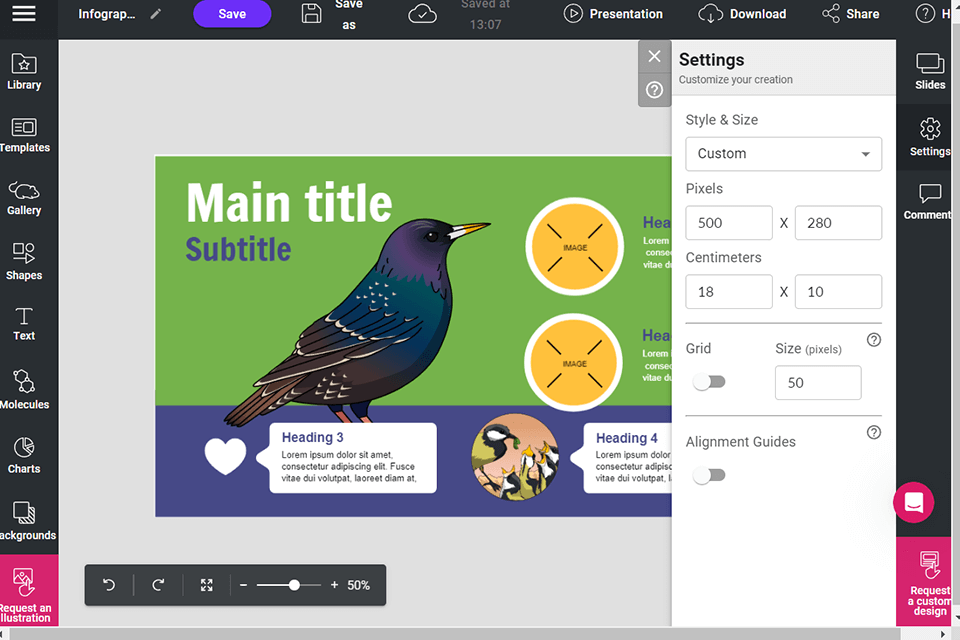
Verdict: Infogram is the best free infographic maker for those who need to work with numbers and statistics data. Using it, you can display complex information as visual charts, diagrams and maps. Also, you can create animated charts there.
The free version provides over 30 various types of charts and more than 10 maps. To expand the software functionality, you need to subscribe for $25/month.
★★★★☆ (4/5) Basic editing tools
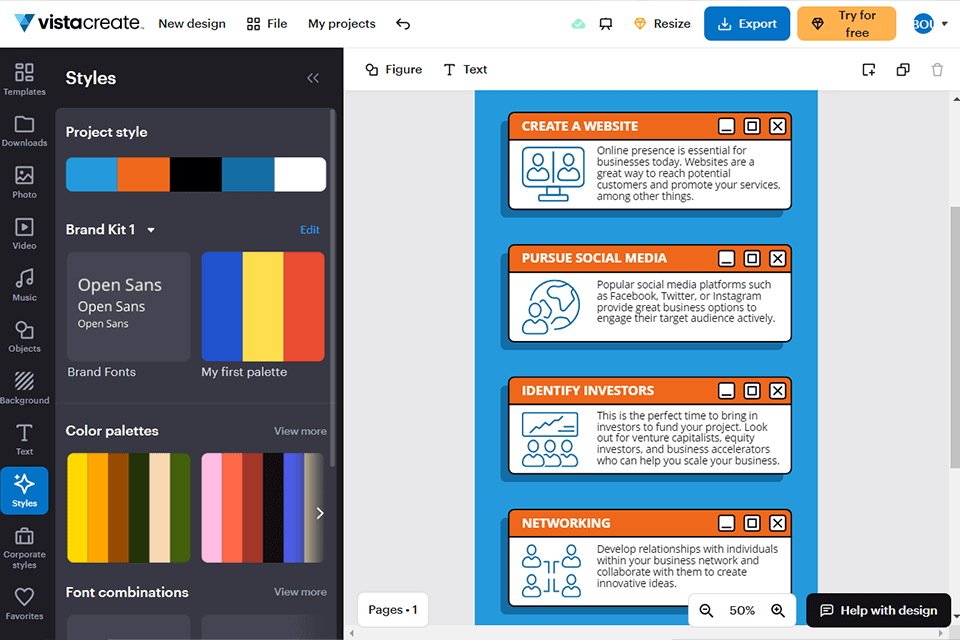
Verdict: With VistaCreate you can create custom templates that are tailored to your audience and brand. The template library is diverse, offering various styles and formats, including single-column designs for linear flow, two-column designs for comparisons, and multi-section layouts for complex content.
Furthermore, the search feature helps you find the right template quickly, and you can even upload your own photos or graphics to make an infographic truly one-of-a-kind. This postcard design software also has the ability to resize designs to fit different platforms like Instagram, Facebook, and YouTube, though this feature is available in the Pro version for $13/mo.
★★★★☆ (4/5) For start-ups
Verdict: With Snappa within minutes, you can whip up a stunning infographic that looks like it was created by a professional designer. It offers over 6,000 templates and 5 million stock HD photos and graphics to choose from. Plus, you can add vector elements to your infographics, which really adds that extra impact.
This graphic design software has the free version, but while the free plan is great for basic needs, the paid plans (starting at $15/mo) offer even more customization options and unlimited storage for your projects.
★★★★☆ (4/5) Easy-to-use
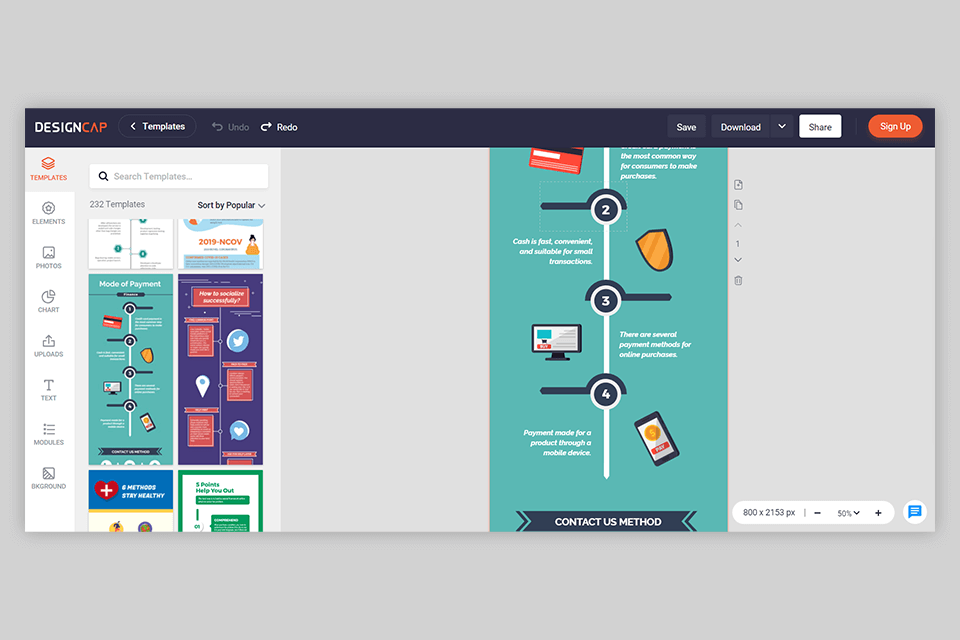
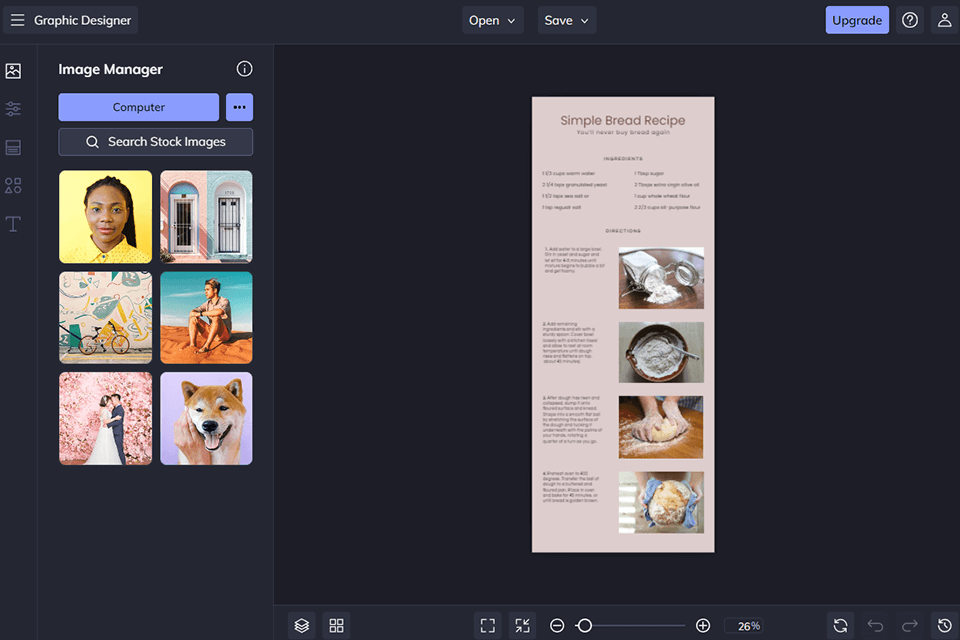
Verdict: One of the biggest perks of DesignCap is its extensive library of templates. Whether you need to create a presentation, poster, report, social media art, or blog graphic, DesignCap has got you covered. The templates in this infographic generator are easily customizable, allowing you to tailor them to your specific needs.
If you're looking for more fonts, advanced graphics and icons, and resizing capabilities, you might need to consider upgrading to a paid plan for $8.99/mo. However, the free version of this flyers software is still good and offers plenty of options for creating impressive infographics.
★★★★☆ (4/5) Research infographic
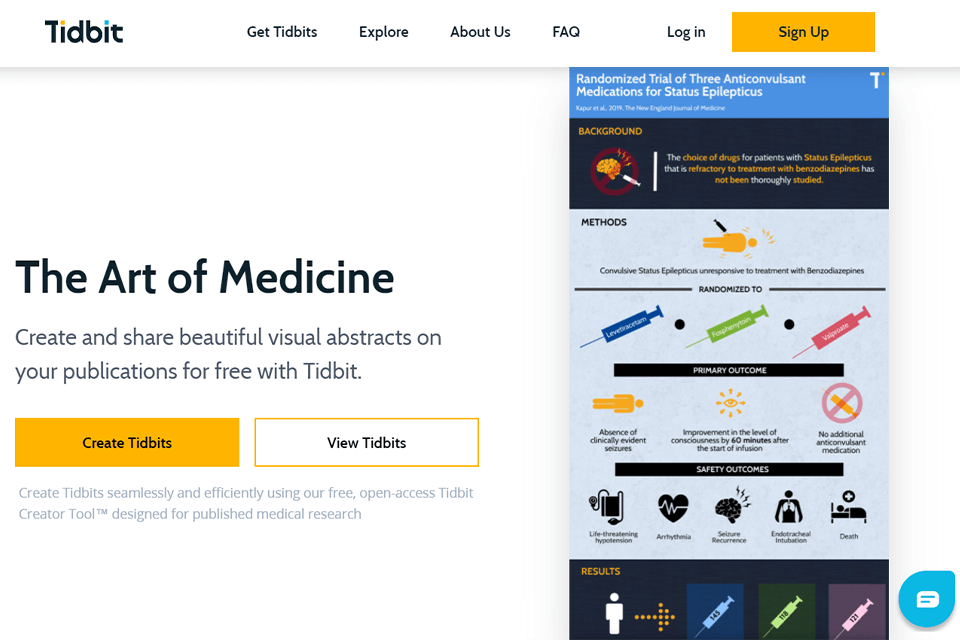
Verdict: With Tidbit, you can design amazing visual abstracts on your publications and share them with your friends and colleagues. This service has an intuitive use, which allows you to create engaging infographics even without graphic design skills. Tidbit is a perfect option for professionals and beginners alike.
★★★★☆ (4/5) Scientific infographic
Verdict: Mind the Graph has a simple editor and customizable templates that make it simple to create stunning graphics. It offers over 6,000 scientific illustrations, including diagrams, timelines, cycles, and more. This makes it perfect for academic works and research papers.
Mind the Graph has free Starter plan and a Student plan that is one of the cheapest options available. With this plan, you get 10 illustrations per month, which is a great deal for the price.
★★★★☆ (4/5) Video infographic
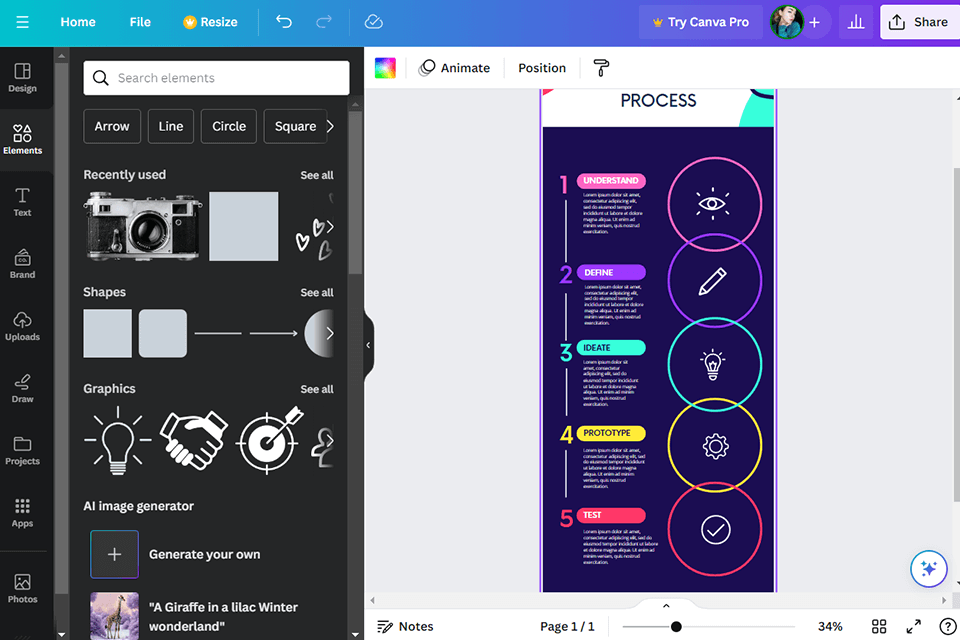
Verdict: Canva photo editor is a widely-used online infographic maker that has a lot of picture editing tools. You can choose from 8000 free templates and edit them in order to create your infographics. You can add images, text, design grids, icons, frames, stickers and textures to your projects.
Also, this photo editing software for PC and Mac offers many advanced tools, including image transparency, photo enhancer, speech bubble maker, blur, vignette, etc. There is a premium paid version for $14.99/mo, which is mainly used for business purposes. For a regular user, free tools will be enough.
★★★★☆ (4/5) Also for mobile
Verdict: BeFunky provides a wide range of templates that are easy to edit, allowing you to customize your infographics with images, text, colors, and layouts. Plus, they even let you upload your own designs and photos for further customization.
In terms of main features, BeFunky offers a huge library of resources, including icons, fonts, scenes, and images, giving you plenty of options to choose from. BeFunky offers a free plan with a watermark on your infographics. However, if you want to remove the watermark and access more advanced features, they offer Pro plan starting at $12 per month.