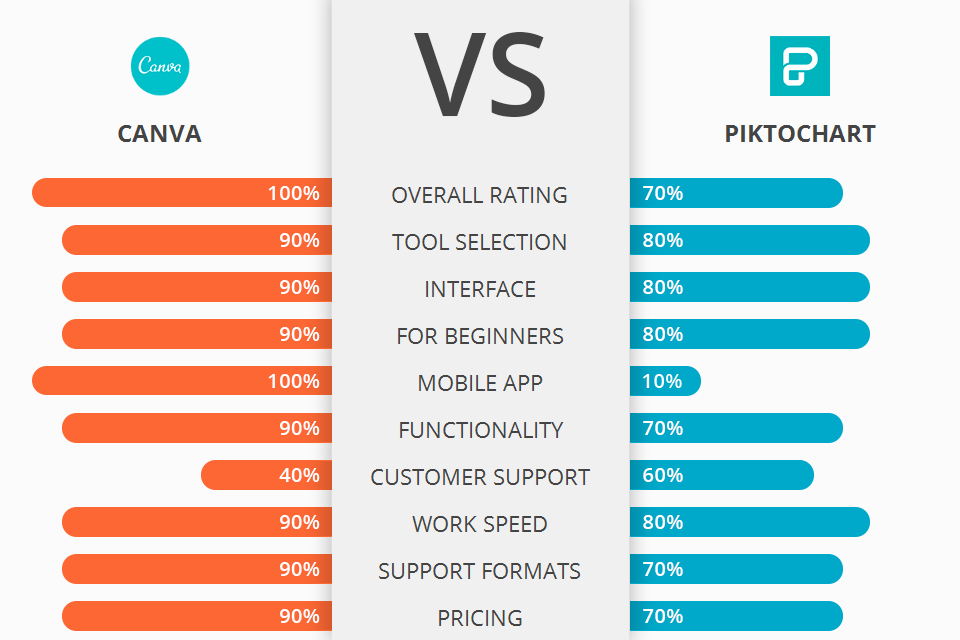
Are you choosing between Canva vs Piktochart? First read my comparison of these two programs for creating graphics.
Canva is a simple drag-and-drop website design tool that enables you to quickly create almost any kind of graphical content with utmost ease.
Piktochart is an online charting tool that allows users to easily create visual graphics and infographics with themed templates, without the need for any programming knowledge.
Canva allows you to quickly and easily create your company profile, add new products or services, create web pages, design and develop the look of your site, add store forms, add a shopping cart and much more. Also it is a great platform for visual graphics creation, that makes it much more powerful than Piktochart with its limited functionality.
Canva Features:

Canva offers many different templates for you to choose from, so you can always find one that best fits your needs and specifications. And because you can easily upload your own original content from your computer or photo gallery, you have a lot of flexibility when it comes to customizing your website.
Once you've created a nice layout, then all you have to do is place the elements that you want to place on your page. You can use the drag-and-drops feature to change the fonts, logos, colors, borders, background image, and more - Canva takes care of everything. Your main task is to focus on the visual content that you want to emphasize or enhance.
There is a number of options which you will be able to use one you launch Canva, including the ability to create photo book albums and editable pages, as well as publishing and sharing your work through a number of different ways. If there are some questions, online tutorials will help you a lot.
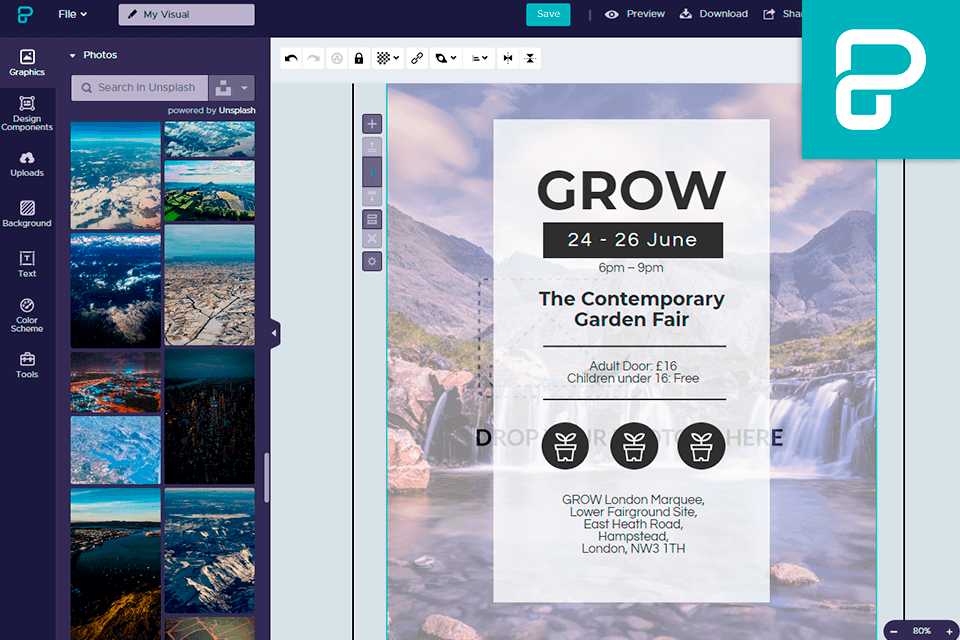
One of the best features of Piktochart is that it provides several visualizations and diagrams that are very easy to understand and customize. It also provides additional features that make its works easier and save you lots of time required to create an infographic or visual.
Some of the capabilities like the option to draw a line from one cell to another, hiding borders and the ability to change font colors can be customized according to your needs at any time. One more feature of Piktochart is the ability to export to Microsoft Excel. It is widely used by business people to manage their data and documents and this particular tool is so flexible that even a beginner can use it confidently.
Some of the features include the ability to embed Google Maps in your infographic, a 'create your own cool visual' button, the ability to export to JPEG and PDF, drag-and-drop option, pie charts, pop charts, custom headers, and lot more.
| STARTING PRICE | $9.95/month | $29.00/month |
| FREE TRIAL |
| WINDOWS | ||
| MAC | ||
| LINUX | ||
| iOS | ||
| ANDROID |
| LIVE SUPPORT | ||
| PHONE | ||
| CHAT SUPPORT |