

When I first started learning how machine learning could be used in real estate, I quickly understood that good data is the basis of every strong model. A real estate datasets for machine learning is simply an organized collection of information, usually in tables with rows and columns. In real estate, this data can include property prices, locations, sizes, features, local population data, and more.
Machine learning models use these datasets to learn patterns, predict home prices, find good investment options, and even estimate property values using photos. If the data is poor or limited, even advanced models will give weak or biased results.
While working as part of the FixThePhoto team, I needed to study real estate datasets for a project focused on image-based property analysis. Our goal was to improve how AI could analyze real estate photos for listing platforms.
To do that, we needed large and trustworthy datasets that combined property images with structured details like price, location, and property features. This pushed me to test 50+ real estate datasets for machine learning.
In real estate, data-based decisions have changed how pricing, forecasting, and investing are done. Instead of depending only on personal judgment, machine learning models can analyze large amounts of data to find patterns in the market behavior.
By looking at past sales, economic changes, and neighborhood details, these models help investors spot underpriced homes, help developers discover buyers' needs, and help agents set accurate prices. From my experience, AI models work in a similar way to human analysts, but they can handle much more information at once.
For example, when I train a model, it learns how factors like home size, number of rooms, location, and market conditions affect prices. More advanced models can also study property photos to judge visual quality or design style. What I find interesting is that these models get better as they learn from new data, which improves their predictions over time. The data is what makes the system smarter.
That said, working with real estate data is not easy. One major problem I often face is inconsistency that occurs because listings from different areas may use different formats, units, or terms. Some datasets include detailed neighborhood information, while others leave it out.
Missing details, such as when a house was built or whether it was recently updated, can reduce model accuracy and create bias. On top of that, regional differences like local tax rules or building styles make it hard to build one model that works well everywhere.
Because of these challenges, I have learned to handle real estate data carefully. Before using it in any machine learning process, I always check its quality and context.
| Dataset type | What it includes | How to use it in ML | Why it’s important |
|---|---|---|---|
|
🏠 Property listings data
|
Basic features like location, price, square footage, amenities, property type, and year built.
|
Used to train supervised learning models to predict housing prices or classify property categories.
|
Acts as the core dataset for most real estate ML models – defines the property itself. |
|
💵 Transaction & historical sales data
|
Records of past sales, transaction dates, buyer/seller info, mortgage amounts, and sale prices.
|
Used to train regression models and understand market dynamics over time. |
Enables price forecasting and helps detect undervalued or overvalued listings. |
|
🌍 Geospatial & demographic data
|
Data on neighborhoods, population density, income levels, school ratings, proximity to public transport, etc.
|
Combined with listings data to enrich feature sets and improve model context.
|
Gives ML models a sense of location intelligence, essential for realistic valuation. |
|
📈 Economic & market indicators
|
Mortgage rates, inflation, employment rates, and housing supply metrics.
|
Used as external variables in predictive models. |
Adds macro-level insight, connecting local prices with national economic trends. |
|
🛰 Satellite & image-based data
|
Aerial images, property photos, and street views.
|
Used with computer vision models (CNNs) to evaluate property conditions visually. |
Helps automate visual quality scoring and architectural style recognition.
|
|
📅 Temporal data (time-series)
|
Historical price trends, listing durations, and seasonal fluctuations.
|
Useful for forecasting future market movements and detecting cycles. |
Captures market seasonality, which is critical for investors and realtors. |
|
🧾 Government & registry data
|
Official property records, land registry, zoning information, and legal ownership.
|
Ensures compliance and validation of datasets before modeling.
|
Provides credibility and legal accuracy to the ML data pipeline. |
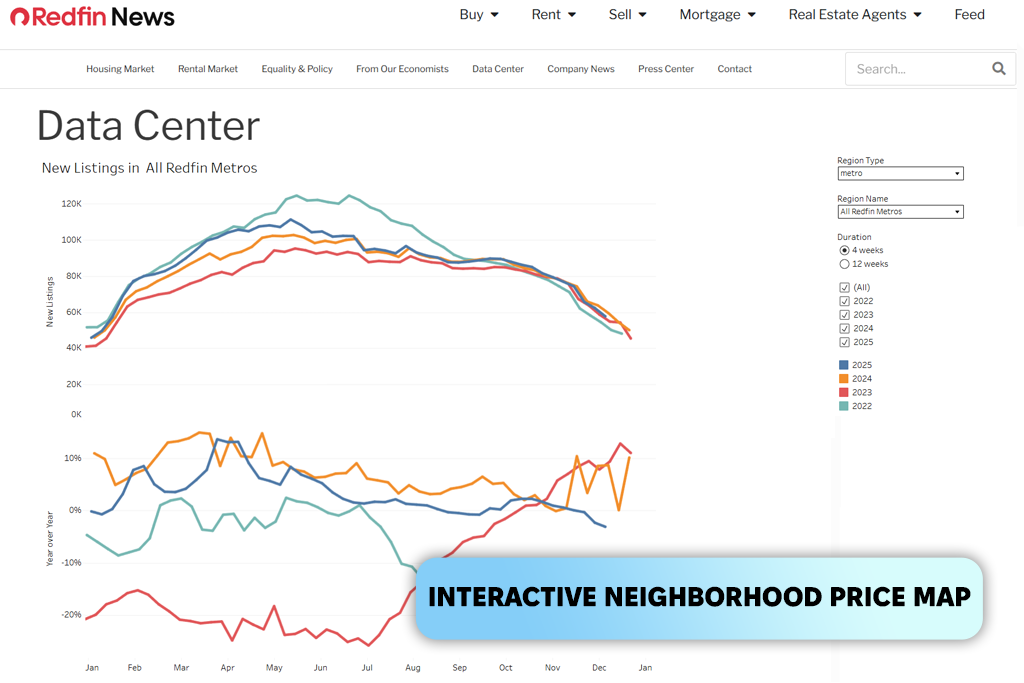
When I learned that Redfin tracks about 92 million properties across the United States, it immediately stood out to me. The fact that its price estimates are accurate for about 98% of homes on the market and 93% of homes off the market made a strong impression. That is why I place this real estate website at the top of my list.
These numbers are not just for show – they help create more stable models and better predictions. Even small pricing errors can affect how a regression model performs.
The first time I used Redfin data, I was building a pricing model that mixed listing details with photo-based features. The process felt smooth from the start. The CSV files were well organized, column names were clear, and very little data cleaning was needed.
What I liked most was the level of detail: the dataset included neighborhood information, agent performance data, and full sales histories. This meant I could improve my ML pipeline without searching for extra data sources.
I have noticed that opinions about Redfin are mixed, and my own experience reflects that: the real estate datasets for ML are easy to use, with clear filters, maps, and a friendly layout, but at the same time, I did come across some problems with images and privacy. During one data collection task, I found a few listings with duplicate or unauthorized photos, which raised concerns.
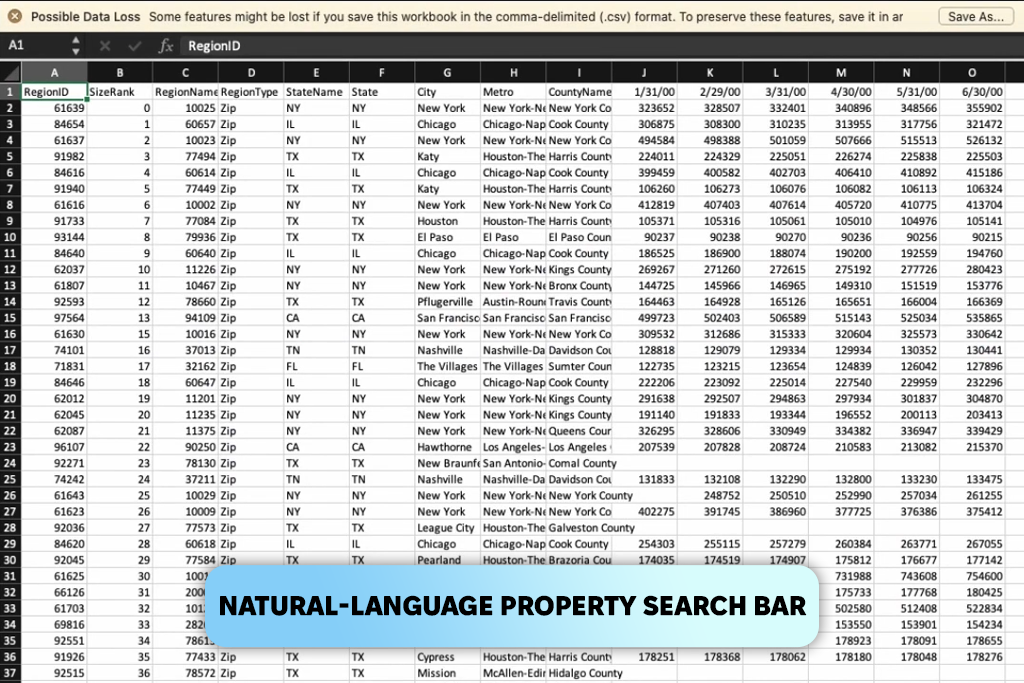
To test Zillow, I tried informal and simple searches like “a small condo with lots of natural light near good schools.” Zillow has added an ML-based NLP system that understands how people describe homes in everyday language. It scans large numbers of listings and finds results based on meaning, not just keywords. This made me curious to explore its dataset for machine learning in more depth.
When I started working directly with Zillow’s data, I noticed that it was built with language processing in mind. Many fields were text-rich, such as interior descriptions, tags, and condition notes, and they followed a consistent format. I combined these text fields with property images, and for once, the text data did not need heavy cleaning.
What impressed me most was how well this AI software performed when I used both images and text together. Models that used photos and descriptions were more stable than those that relied only on numbers.
However, location data was less consistent. Some listings had detailed geographic information, while others were missing key details. To fix this, I often added extra neighborhood datasets to complete the analysis.
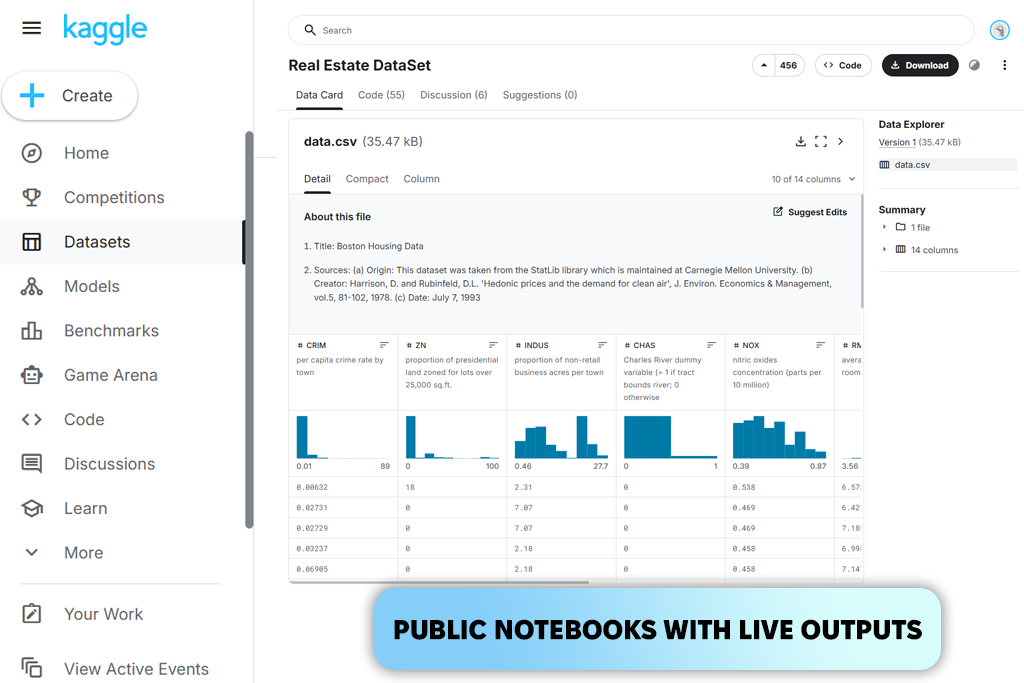
It was my coworker Eva who first suggested that I try Kaggle as a real estate dataset for machine learning. When I opened it, it felt like entering a huge digital library full of housing data. There were datasets about property sales, rental prices, global housing indexes, and even very specific topics like how taxes affect housing markets. At first, it felt like a lot to take in, but in a positive way.
The Ames Housing dataset, which comes from one of Kaggle’s well-known competitions, became my entry point. I spent my first evening just looking through how carefully every feature was explained. It included details about fireplaces, land shape, basement quality, and even outside wall materials. Whenever I got stuck, I could always find a public notebook where another data scientist shared a smart way to improve features.
As I moved on to more advanced Kaggle datasets (global rental data, regional price histories, and combined tax and economic data), I started to see how the AI website supports experimentation. One day, I would be analyzing how interest rates relate to housing prices in reality, and the next day, I would be testing clustering models on neighborhood price differences.
At the same time, I began to notice a common problem: some datasets seemed rushed, with missing labels, mixed formats, or empty columns.


I discovered Skyline by accident while searching online for something unrelated. It appeared near the top of the results, and I clicked on it out of curiosity. That click led me into one of the more interesting areas of property technology I’ve explored. Skyline is an Israeli company that gathers data from hundreds of sources and tracks more than 400,000 commercial properties.
As I explored their data, what stood out most was how focused it was on investing. Instead of simple property details, the data emphasized expected returns, early market signals, and investment opportunities. Many of these insights are things I usually have to calculate myself.
Skyline uses machine learning to not only describe what the market looks like now, but also to suggest how it may move next. I tested this by comparing their “emerging opportunity” signals with my own models based on past trends. In several cases, Skyline spotted changes weeks before my models did.
That said, using this real estate app was not always straightforward. Because it focuses on commercial investment, the data sometimes felt too general when I needed very detailed features for training models. I also had to be careful with certain values, since some of them were computed metrics instead of raw data. This can make feature engineering harder when full transparency is needed.
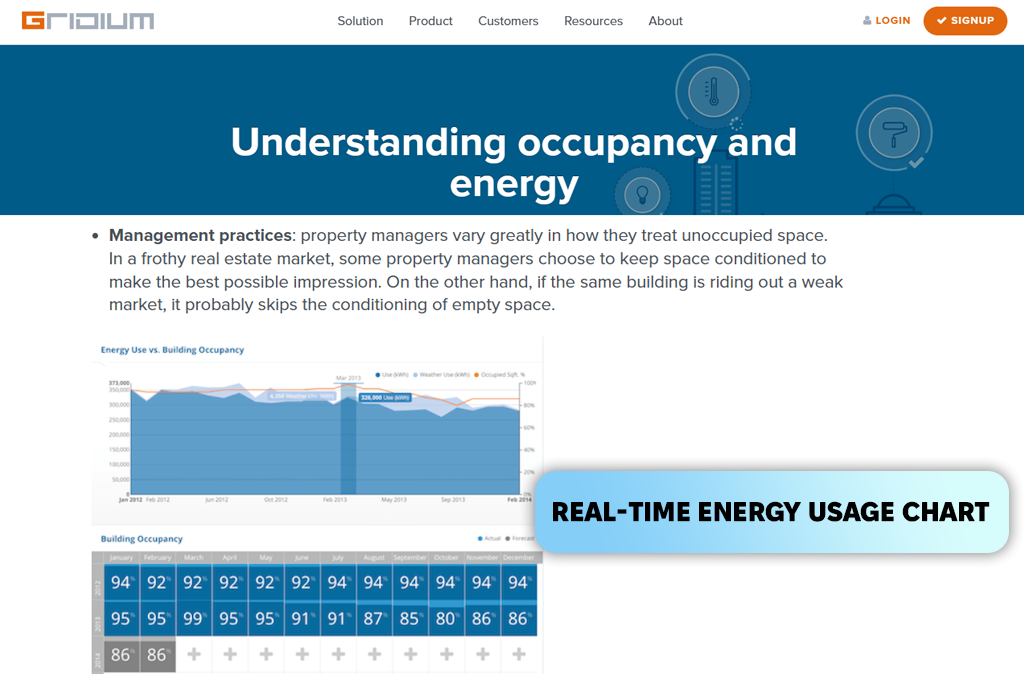
I was searching for datasets related to building efficiency, and Gridium kept appearing in industry examples. What made me take a closer look was a case study explaining how a real estate investor KBS saved $47,000 on electricity and operating costs at the Premier Office Towers in Emeryville, California, by using Gridium’s machine-learning system.
Instead of working with prices or property listings, I ended up studying energy records, machine usage cycles, and maintenance activity. It felt like going through a daily log of how a building works, showing every rise in power use, every issue with heating and cooling systems, and every unusual operational change. Once all this info was organized inside platform, patterns became easier to see.
Using Gridium as a real estate dataset for ML was not without challenges. I had to adjust how I built features because the data focuses more on building operations than on market trends. At times, I wanted more background details, such as how many tenants were in the building, how often spaces were used, etc. Since this data was missing, I had to add it from other sources to improve my models.
Before training any machine learning model, I remind myself that real estate data is rarely ready to use right away. No matter the source (property listings, sales records, or energy data), each dataset comes with missing values, formatting problems, and small errors.
Step 1. Data cleaning and normalization. My first task is to make the data usable. This includes removing duplicate entries, fixing strange formats, converting measurement units, and handling missing information with help from a data analytics platform.
Real estate data is known for inconsistencies. For example, one listing might show size in square feet, while another uses square meters. So, what I like to do is standardize everything early, so these issues do not cause problems later. This step may feel routine, but without it, models can give unstable results.
Step 2. Feature engineering that match real market behavior. Feature engineering is where I add new variables that are not directly included in the original data. Examples include price per square foot, how long ago a property was renovated, distance to public transport, or visual quality scores when images are available. These new features often become the most important inputs for the model.
Step 3. Encoding the categorical data. Real estate datasets contain many text-based fields like property type, heating system, building materials, neighborhood names, and amenities. These categories are often inconsistent and need to be converted into a format that models can understand.
Depending on the model, I use methods such as one-hot encoding, ordinal encoding, or target encoding. In some cases, the categories vary so much between regions that I have to group or simplify them before encoding.
Step 4. Adding location-based data. Location data is one of the most powerful parts of real estate modeling. I add map coordinates, neighborhood borders, school quality scores, crime data, walkability ratings, and sometimes even features taken from satellite images. After linking this information to each property, the dataset becomes far more detailed and context-aware.
When FixThePhoto team and I started to test these real estate datasets for machine learning, we treated them the same way we would treat data for a real client project. We began with small steps, checked our assumptions, and pushed the data to see where it might fail.
I looked at how many features break when they are standardized, whether location fields can be correctly turned into GPS coordinates, and how stable prices stay after removing extreme values.
The next step was building a simple “baseline model,” which Eva handled. She used only the most basic features, such as price, property size, number of bedrooms, year built, and location. The goal was to see if the dataset was consistent enough to show a clear trend. If the baseline model failed (for example, if the results jumped around, showed a negative R² score, or overfitted right away), we knew the dataset had deeper structural issues.
After that, Nataly focused on feature stress testing. She added new engineered features one at a time and watched how the model reacted. If adding location-based features improved results, it meant the data foundation was solid. If adding image-related features caused instability or noise, it showed that the dataset was not suitable for visual data.
Another key step was testing how the data handled time. For datasets with past prices or transaction dates, I used time-based splits instead of random ones. This approach helps reveal missing data during certain years, which is common in local U.S. records. If a model works well with random splits but fails when tested over time, it signals that the dataset cannot be trusted for future predictions.
In the final step, we tested the dataset’s scalability inside a real ML pipeline. A real estate dataset for ML might look good in a notebook but fail in a production setup. I checked how fast it loads, whether there are API limits, how stable the data structure is when downloaded again, and whether category labels stay consistent over time.
Some datasets seemed fine at first, but when I reran the pipeline a week later, many category names had changed, which caused the encoders to fail.