If businesses understand the analytics, they are able to take better decisions about their resources distribution and setting a price for their products. Furthermore, a data analytics platform can assist entities to identify trends and comprehend their customers, as data visualization tool can track and analyze the information, letting you make effective reports and dashboards.
While opting for the best data analytics tools, the first thing you need to do is get the types of information your company is willing to analyze, and, consequently, your data integration needs.
Furthermore, before you can start analyzing data, you'll have to select data sources, the tables and columns within them, and duplicate them to a data source to make a single reliable database for analytics.
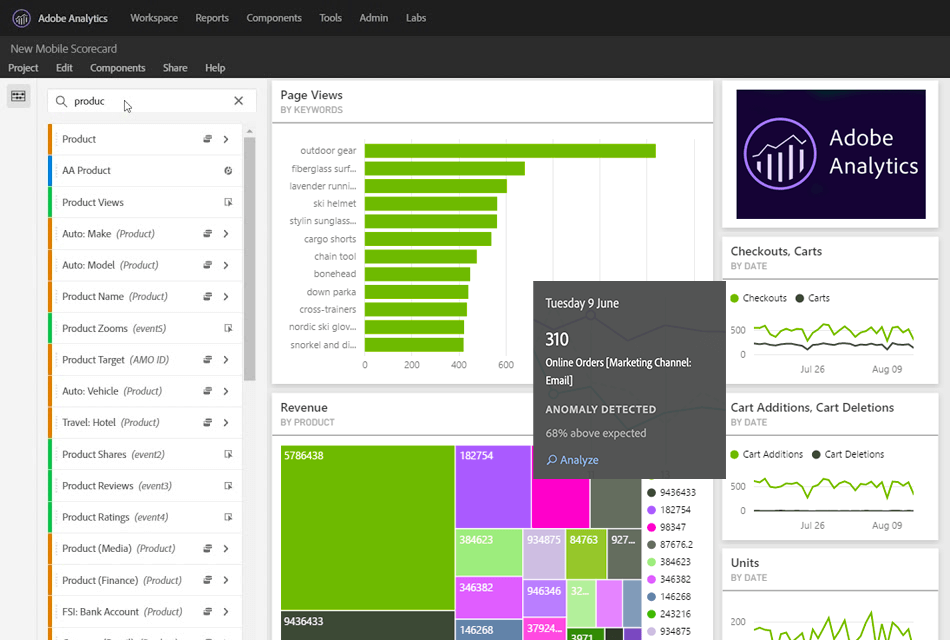
Verdict: Adobe Analytics is a highly functional tool designed to capture, aggregate, rationalize, and process data turning it into a single client profile. It collects info from the web, email, mobile devices, applications, and many other sources to get an overall understanding of your potential customers.
The software allows researching users’ behavior on a website and segmenting them according to these insights to evaluate across reports and other Adobe Experience Cloud products. Besides, by taking advantage of the Analysis Workspace option, it is possible to get a solid and flexible canvas to generate custom analysis metrics.
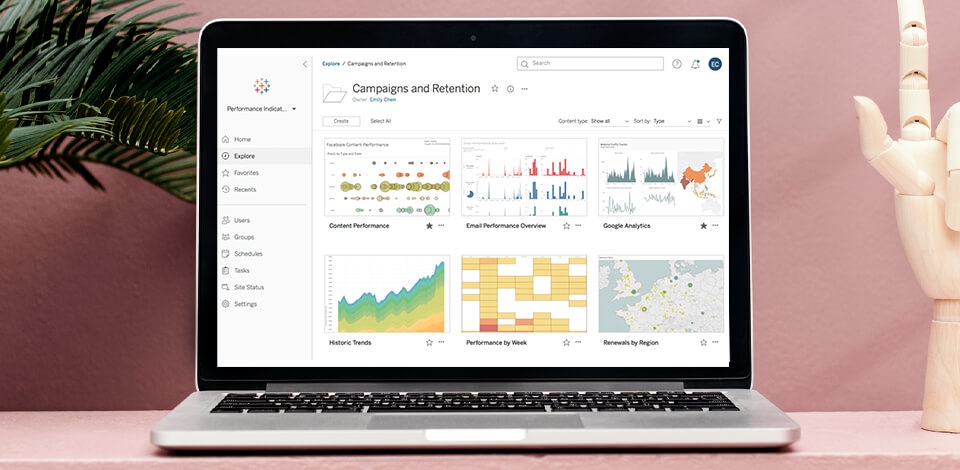
Verdict: The entity’s data analytics solutions are known for gathering different data inputs, letting users mix them, then suggesting a dashboard display that improves visual info mining. Besides, the information can then be arranged and rearranged to produce hierarchical and bin structures relatively with ease. The platform offers pro-grade visualization functionalities like Gantt chart, Treemap, histogram, etc.
This report writing software enables you to get precise data reports prepared for your customers, employees, business partner, etc.
The company’s data analytic software library is available via three main channels: Tableau Desktop, Tableau Server, and Tableau Online. This is a perfect fit for entities of almost all sizes, from large ones to SMBs. You can opt for free trial or from $15/mo.
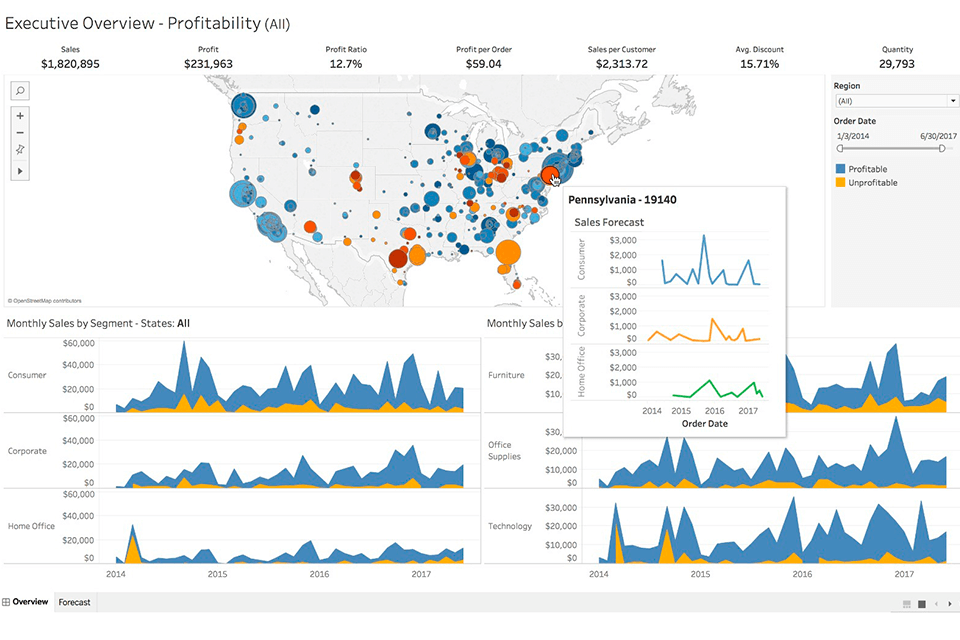
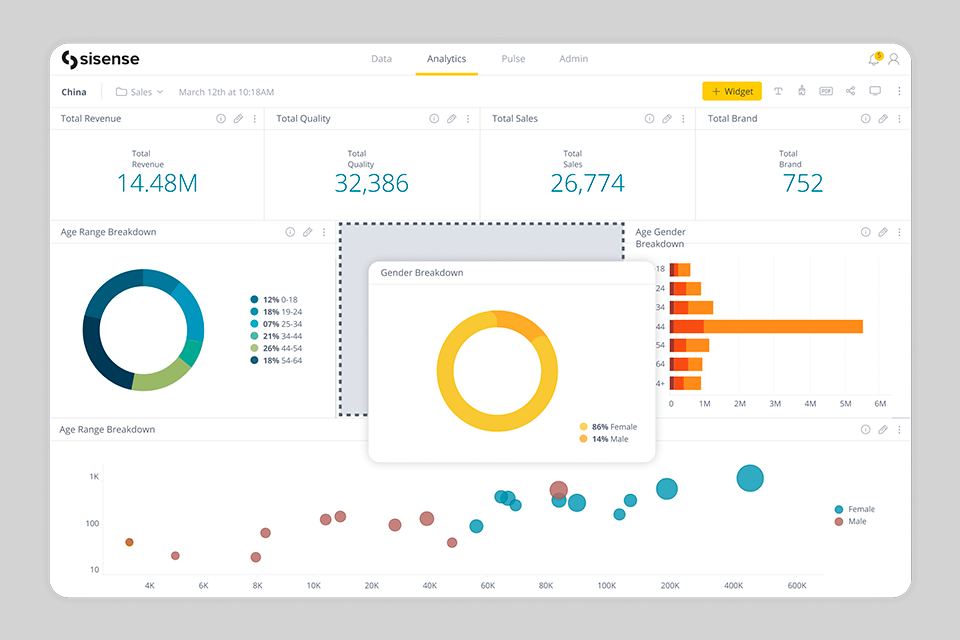
Verdict: Sisense is a data analytics platform oriented at helping both technical designers and business analysts process and visualize all of their corporate information. It fosters a great compilation of drag-and-drop instruments and offers interactive dashboards for cooperation. It is also equipped with great analytical features, and a front-end for dashboarding and visualization.
A specific factor of the Sisense platform is its custom In-Chip technology, which improves computation to use CPU caching rather than slower RAM. For some working processes, this can lead to 10–100x faster calculation. The instrument can export data in CSV, PDF, Excel, Images, etc. The cost is by request.
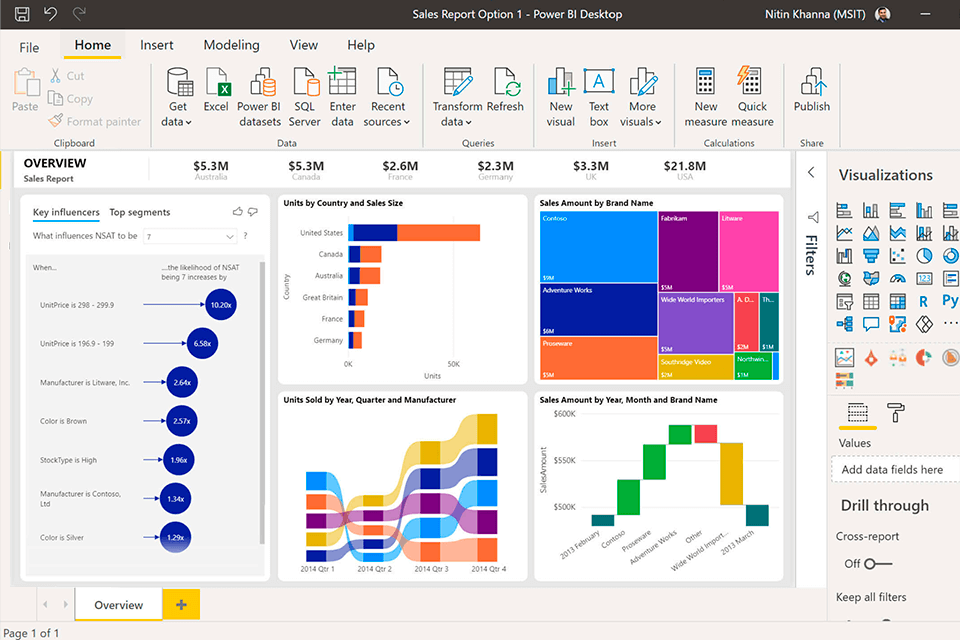
Verdict: Power BI lets customers generate interactive visual reports and dashboards, with a lowest learning curve. Customers may mix a bunch of dashboards and create automated machine learning patterns and incorporates Azure Machine Learning.
It enables you to connect to more than 71 data sources, which also involves expert webinar software. The software incorporates with Excel and Office 365, and features a very intensive user community that extends the tool’s functions.
In reality, it offers several subscriptions, including a free one. There is free trial or from $13.70/mo.
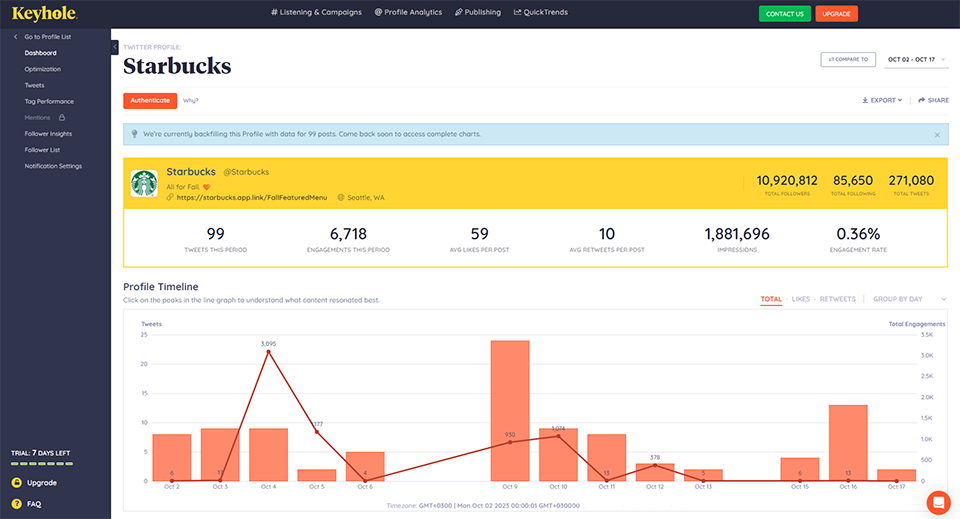
Verdict: Keyhole stands as a powerful and comprehensive tool, offering insights into performance, competitive analysis, and influencer tracking. It streamlines data interpretation through visually intuitive graphs and layouts.
The platform empowers data-driven decision-making and boasts recognition in esteemed publications. Covering major platforms such as Instagram, Facebook, Twitter, and YouTube, Keyhole offers valuable insights into follower growth, engagement, and campaign success.
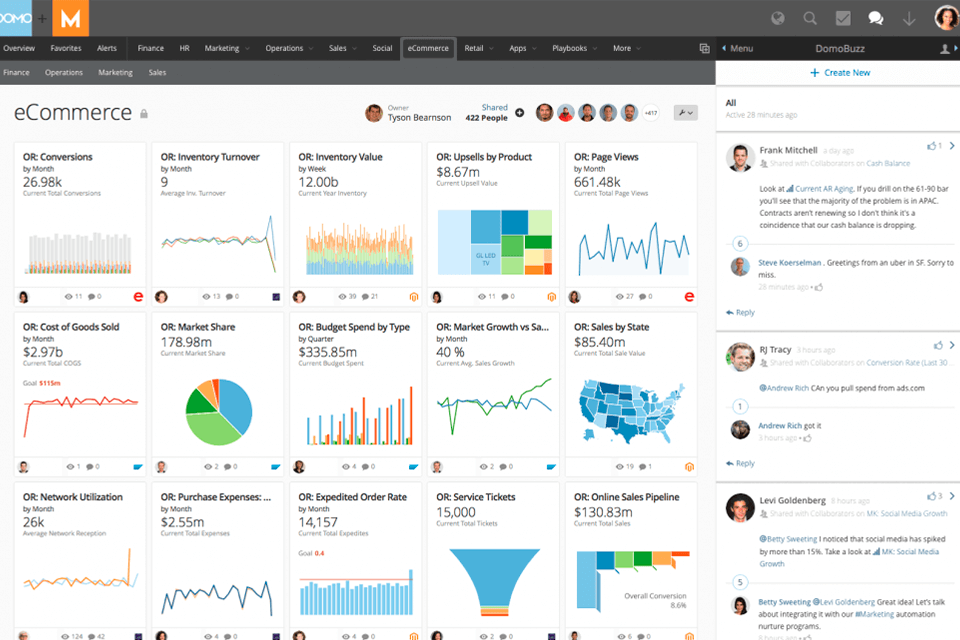
Verdict: Domo is a mobile-first BI platform based on a cloud that assist the firms to deliver more value from their information by letting organizations better incorporate, interpret and employ the data to manage timely decision-making and action in the business. It has a wide array of data connection — more than 600 data connectors, Excel Add-IN, ODBC connectors, and more.
The Domo platform fosters existing information warehouse and BI instruments, and lets the customers create custom apps, automate information pipelines, and make data science accessible for anyone within the organization via automated insights that can be plainly streamed with internal or external stakeholders.
You can either enjoy free trial or you contact sales experts for an individualized quote.
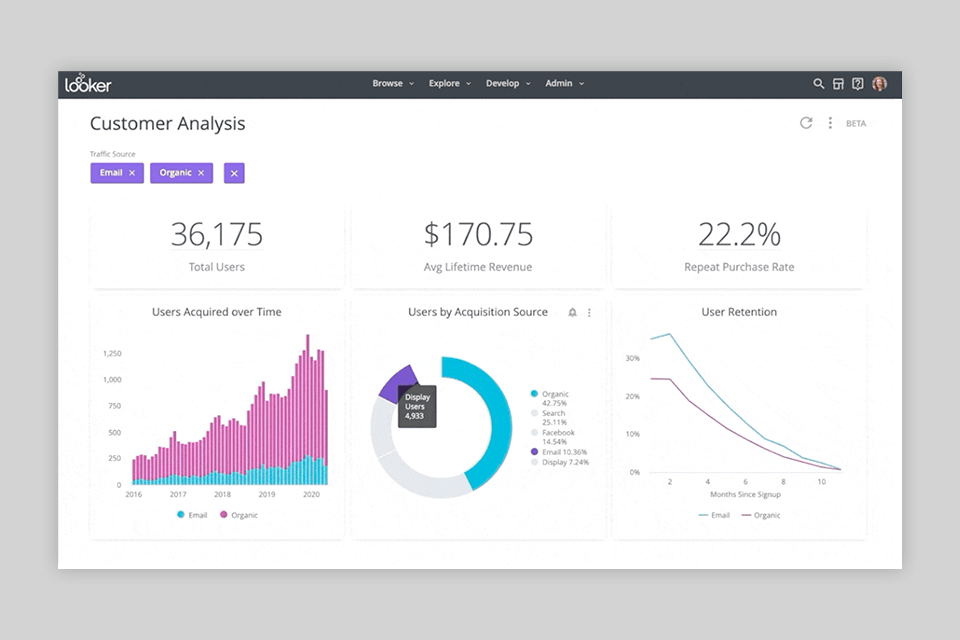
Verdict: Looker delivers a BI and data analytics platform that is generated on LookML, the entity’s proprietary modeling language. The product’s application for web analytics features filtering and drilling functions, letting users immerse into row-level details. This web analysis tool uses contemporary databases and a flexible modeling layer that enables users to detect the information and manage the access.
Companies can apply Looker’s full RESTful API or the schedule functions to offer reports by email or webhook. It is equipped with customized data model creation that scans data schemes and deduces relationships between the tables and databases.
Data engineers can amend the created models through an in-built code editor. You are able to receive a quote for pricing information.
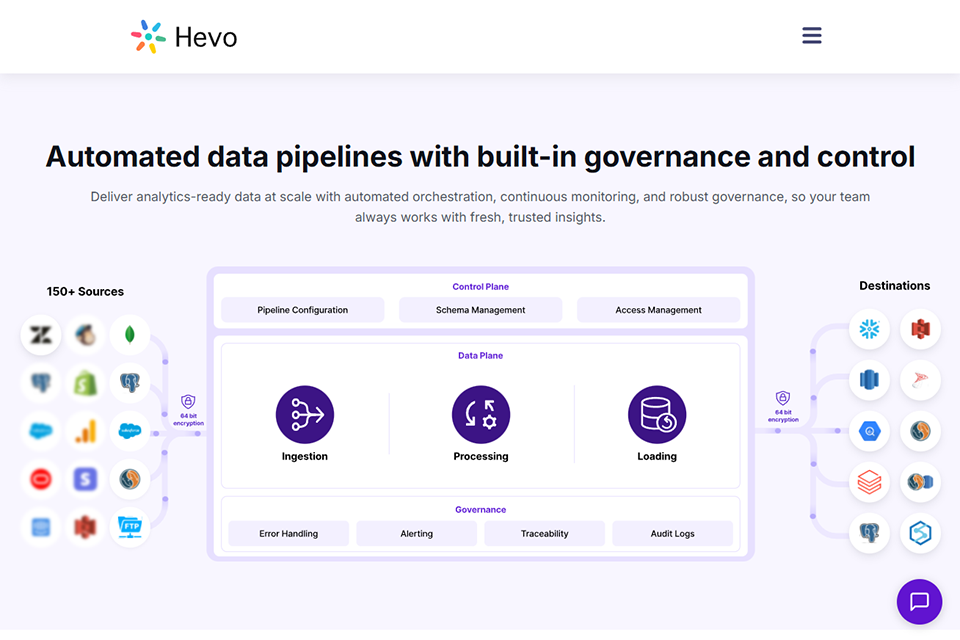
Verdict: Hevo a simple tool when I need to consolidate data from multiple content and sales tools. Used as an analytics platform, Hevo helped me streamline the manner that the information moved between my client database, payment gateway, and analytics panel — without repeated manual uploading or conversion issues.
One of the aspects that surprised me and my team is that it handled schema changes from external applications smoothly.
I also benefitted from its dbt integration to reshape and transform the data for weekly reporting, which streamlined time spent on planning content campaigns as well as service performance tracking.
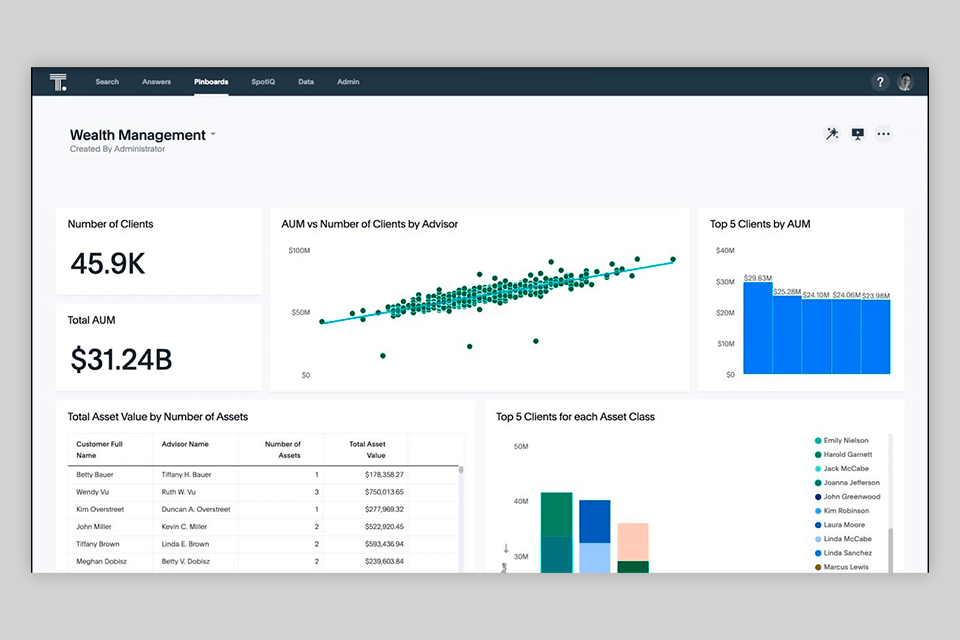
Verdict: Thoughtspot is a data analytics solution letting the customers to explore diverse sources using reports and natural language searches. With its AI system, SpotIQ which find insights automatically, the clients are able to reveal the patterns they didn't aim to encounter. The software also lets users automatically join tables from various data sources to help break down information silos.
Customers can independently get access to data and analyze it, and generate interactive dashboards and reports, and stream insights to other people, making dependence on IT or data teams lower.
It may deal with great data enquiries, with a lot of customers looking through more than a terabyte of information. The instrument is compatible with Google Cloud Storage. The cost starts from $95/month per 5 users. There is also 30-day trial.
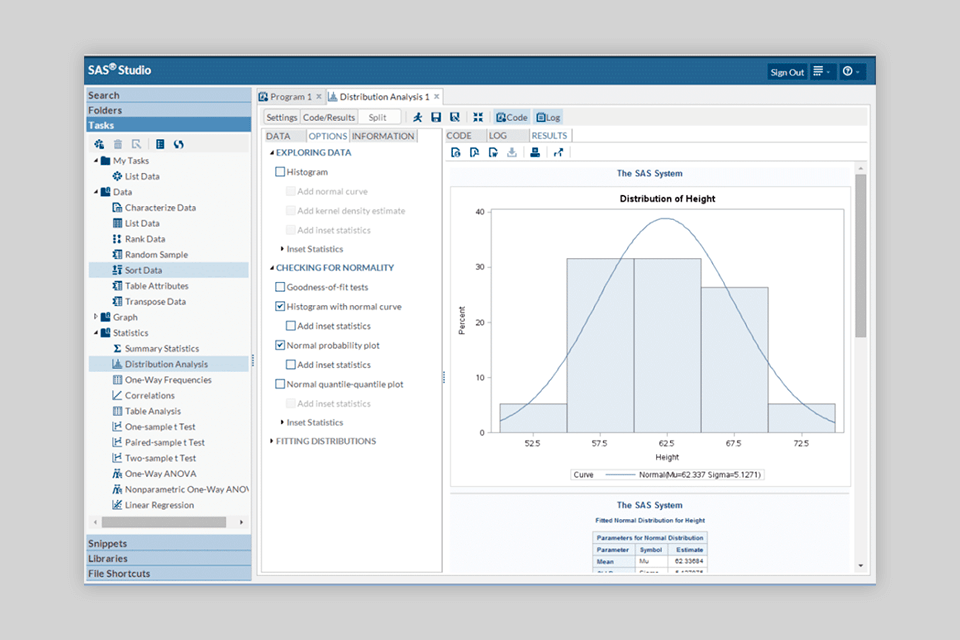
Verdict: SAS is geared for the full scope of data analytics requirements. This ranges from complex model construction to analysis, to data prep, to the ability to monitor and manage data trend lines.
Each of these features is supported by ML, automation, and AI. To assist digital marketing agencies, the platform outputs machine-driven predictions, which can greatly expand the query process.
It features a lot of in-built cooperation functions, such as the importing reports to mobile applications. SAS has made its name as a result of advanced analytics, since the tool can ingest data from diverse data sources and handle complex models.
In addition to BI, SAS offers data management, IoT, personal data protection, and Hadoop tools. You can request a demo and price information.
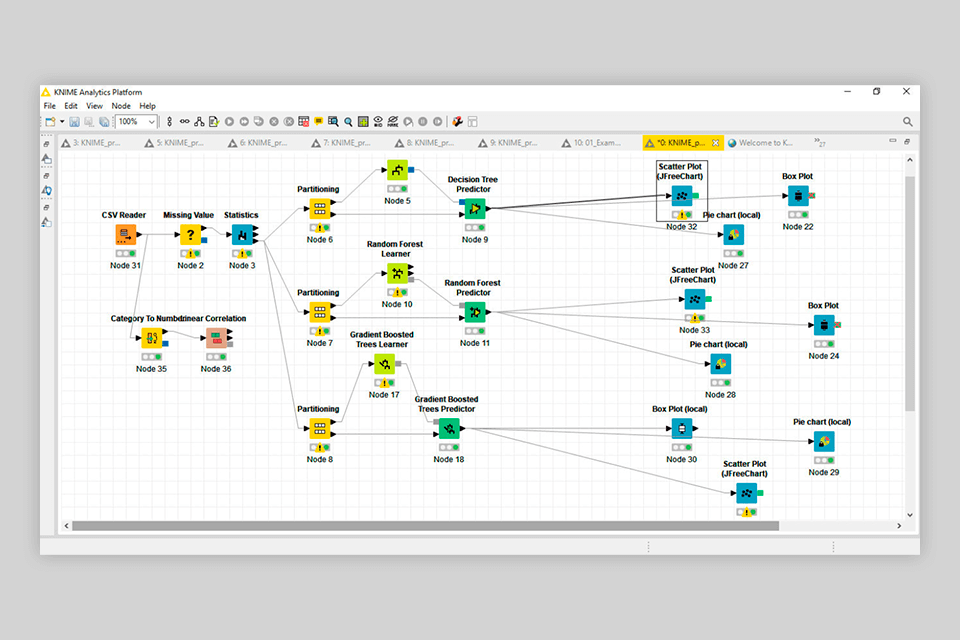
Verdict: The KNIME analytics platform is developed to combine information inputs and insights from various sources seamlessly, while also being useful with visual programming and instrument blending.
So even if your organization has little or even no previous data analysis experience, KNIME is a great place to test drive data solutions for your enterprise. The graphical interface enables point-and-click analysis and modeling.
KNIME also mixes great data volumes: imports and exports HDFS information and execute SQL analytics within Hive and Impala, or generate and control Apache Spark programs within KNIME.
You are able to prepare reports as PDF, PowerPoint, or other formats for delivering results to stakeholders. You can also feature a free plan or you can receive a quote for pricing credentials.
