Infogram is a good tool for making infographics, charts, and content using data. But even though it's simple to use, I started looking for other tools that let me customize more, add interactive features, and can be integrated with other platforms I use.
When I was making this list of Infogram alternatives, I looked for programs that help create dynamic visualizations that also let people interact with them, give you more choices to change designs, connect with different data sources, and allow teams to work together on projects.
To test each Infogram alternative, I tried making an interactive annual performance review for a made-up tech company. The goal was to show key numbers, such as the revenue change, customer engagement, and market trends, not in a boring way.
Also, the project included making different charts, adding videos and filters to explore the data, and designing a simple but also visually appealing layout that could be shared online with the company’s team.
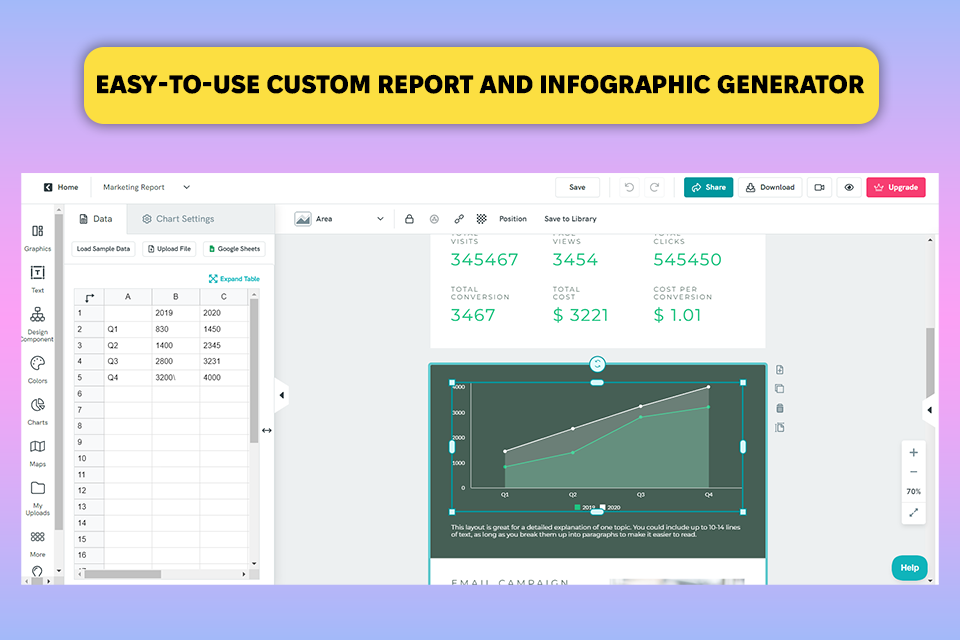
When I used Piktochart, I liked how fast the AI tool made a nice-looking report from my basic text, so I didn’t need to spend much time creating the layout. I just focused on the details to make the report perfect.
Compared to Infogram, this infographic maker made it easy to produce clear charts and put them in the report. Infogram has a more advanced chart editor, while Piktochart was quicker and saved me time, especially for quick changes.
For this project, Piktochart was great for making visuals like timelines showing revenue growth and graphs for customer engagement. The templates and design tools helped me keep the same look throughout the report. I also liked how I could link Google Sheets to update data in the charts without having to change the format every time.
Price: free version or from $29 per month.
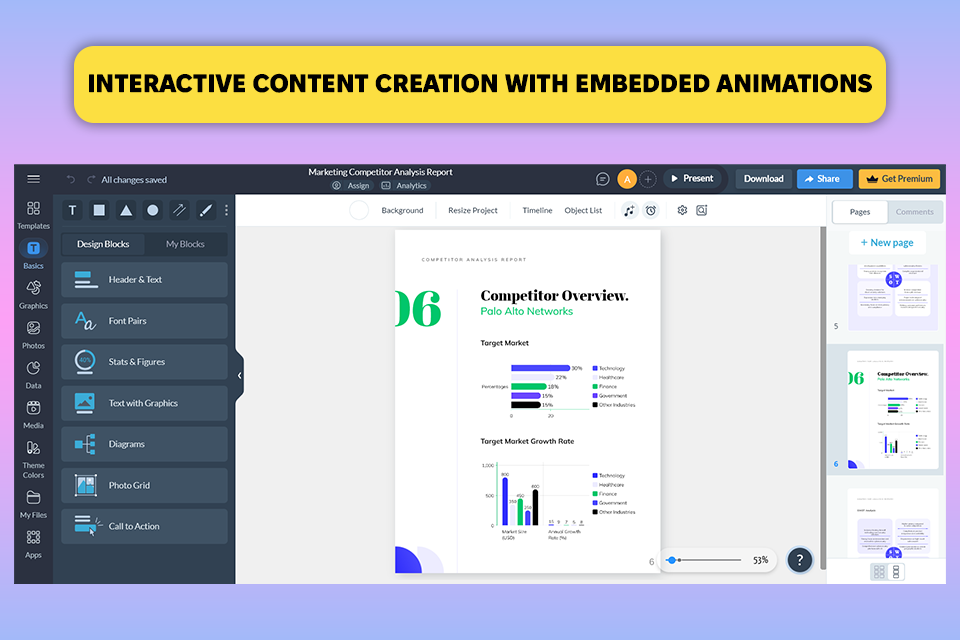
Visme is a little bit different from Infogram because it focuses more on making interactive designs that people can engage with. When I worked on the performance review presentation, I found that this Infogram alternative has various tools like hotspots, clickable menus, and animated features that helped make the presentation more dynamic for the executive team.
Infogram is more focused on data, with lots of charts and graphs, making it better for projects when you need to show quantitative data. But, when I wanted to tell a story with the data, Visme’s interactive features worked better and made a bigger impact.
Visme also has an AI Designer that can quickly create designs from just a text prompt. Although Infogram doesn't have this feature, the program is better for making data look nice. Visme, on the other hand, is better at quickly creating different content, like social media posts or branded documents. However, I did notice that Visme is a bit harder to learn at first.
Price: free version or from $29 per month.
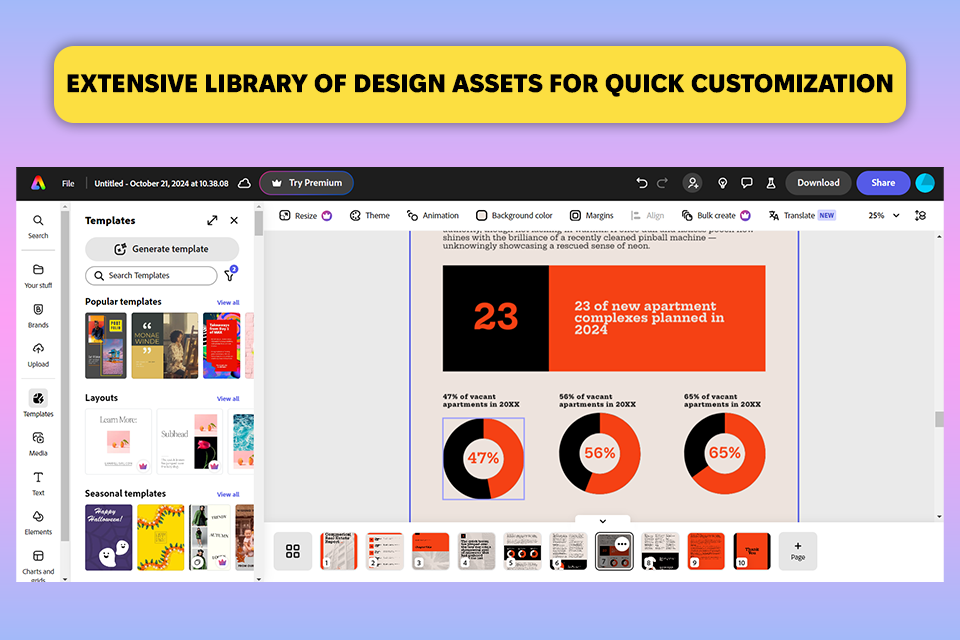
Adobe Express has lots of tools for making visual content, and I found it helpful when designing infographics for my project. It gave me more creative choices than Infogram, which focuses more on showing data. While Infogram is better for making charts and graphs, Adobe Express is better for creating unique designs.
One big advantage of this Infogram alternative is its large collection of professional templates. These saved me time when making different types of content, like presentations or branding. Infogram is ideal for projects with lots of data, but it doesn’t give as much creative freedom for non-data designs as Adobe Express does.
The free version of Adobe Express felt limited compared to Infogram, so I think you may need the paid version if you are looking for an Infogram alternative for serious projects. The interface was a bit annoying sometimes because of too many pop-ups, but once I got used to it, I enjoyed the flexibility it gave me for both designs and branding.
Price: free version or from $9,99 per month.
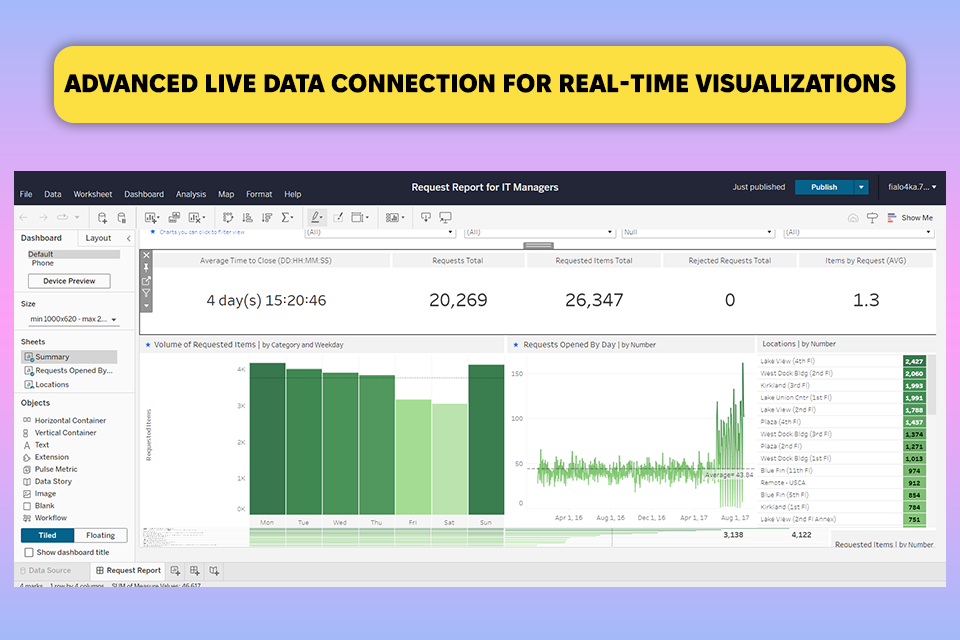
When I used Tableau for a performance review, I found its data visualization tools powerful but a bit hard to use. It was easy to make charts that show revenue growth and customer engagement because Tableau has a drag-and-drop feature. However, this Infogram alternative wasn’t as flexible for customizing things compared to Infogram itself.
Tableau is great for working with large amounts of data that can be imported from many sources, including Excel or SQL. This made it a good choice for the parts of my report with lots of quantitative data. I also liked how I could create interactive dashboards with filters that let people explore the information more in-depth.
The filters and tools for telling a visual story made it easier for people who aren’t familiar with data analysis to understand complex data. But unlike Infogram, Tableau needs a better understanding of how to work with data and use its more complicated tools, which might be unnecessary for some projects.
Price: from $35 per month, free trial is available.
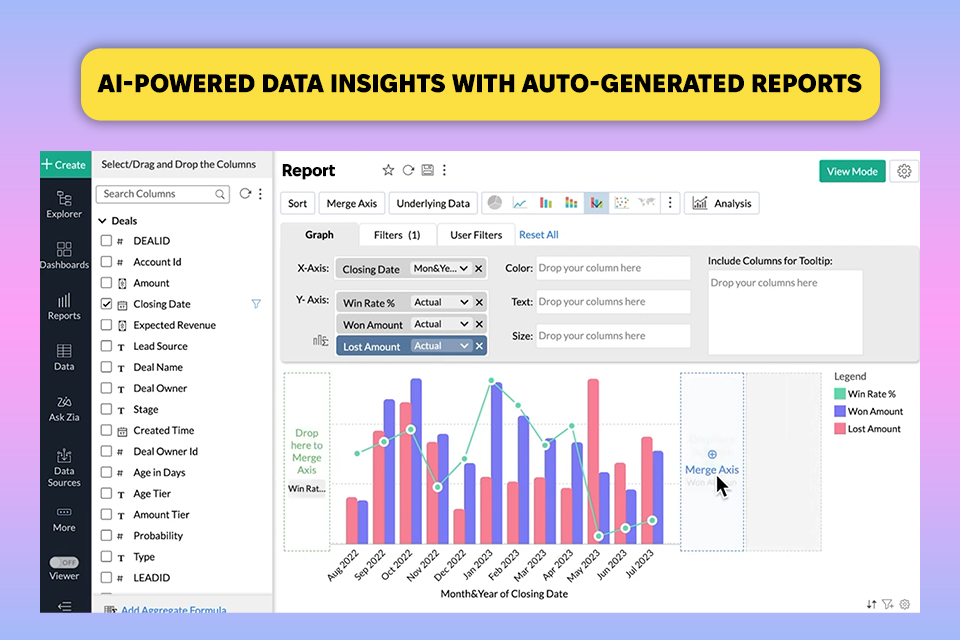
I used Zoho Analytics to create dashboards for a project with a lot of data, and it turned out to be a great Infogram alternative. It’s better than Infogram when you need to work with complicated data. I used its automatic report feature to get a quick data visualization, and I could change the designs to fit what I needed.
While Infogram is easier for simpler visuals, Zoho gave me more control over how to show complex data. I could also share interactive reports with others easily, which was harder to do with Infogram. One feature I liked was the ability to add user filters, which let me show the same data differently.
The drag-and-drop tool for building dashboards was straightforward, and creating complex visuals was easier in Zoho than in Infogram. However, Zoho Analytics may be a bit more complicated to learn, especially when trying to do more advanced analytics. Nevertheless, if you spend enough time learning it, Zoho will give you more flexibility.
Price: from $26 per month, free trial is available.
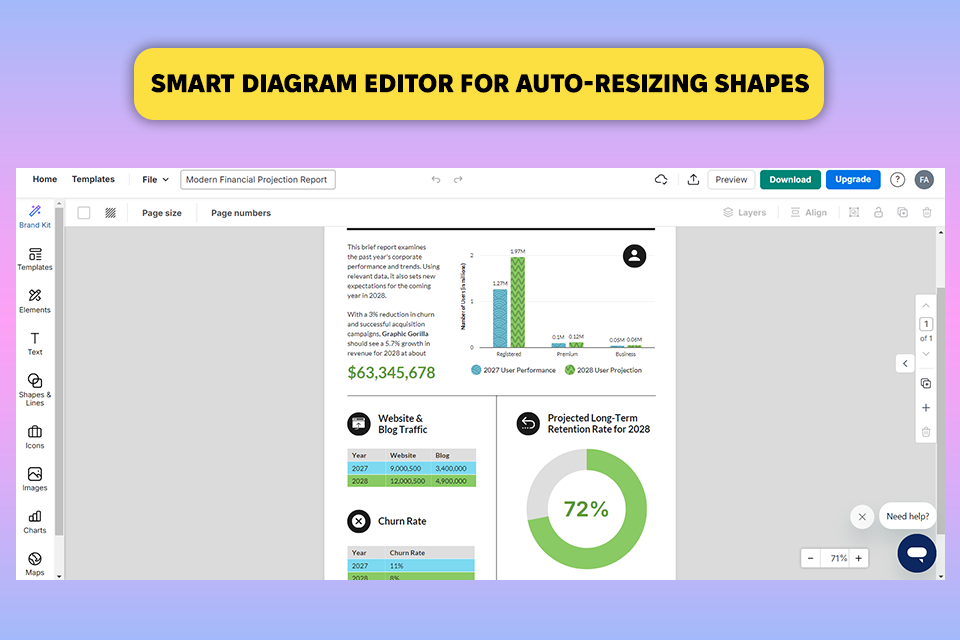
Venngage made it easy to turn boring business numbers, like revenue expansion and client engagement, into professional-looking infographics and reports. I liked the smart diagram features because they helped show complex relationships between market trends, making it easier for stakeholders to understand the data easily.
The drag-and-drop editor and AI tools, like auto-resizing diagrams, saved me a lot of time, making the software more efficient than Infogram in many ways. I didn’t just use Venngage for charts and infographics; I also used it as a program to make checklists.
Nonetheless, when I wanted to add more interactive things, like videos or dynamic charts with data filters, although Venngage could do basic data visualization, it didn’t have the advanced interactive features I needed for engaging stakeholders, which Infogram did much better.
Price: free version or from $19 per month.
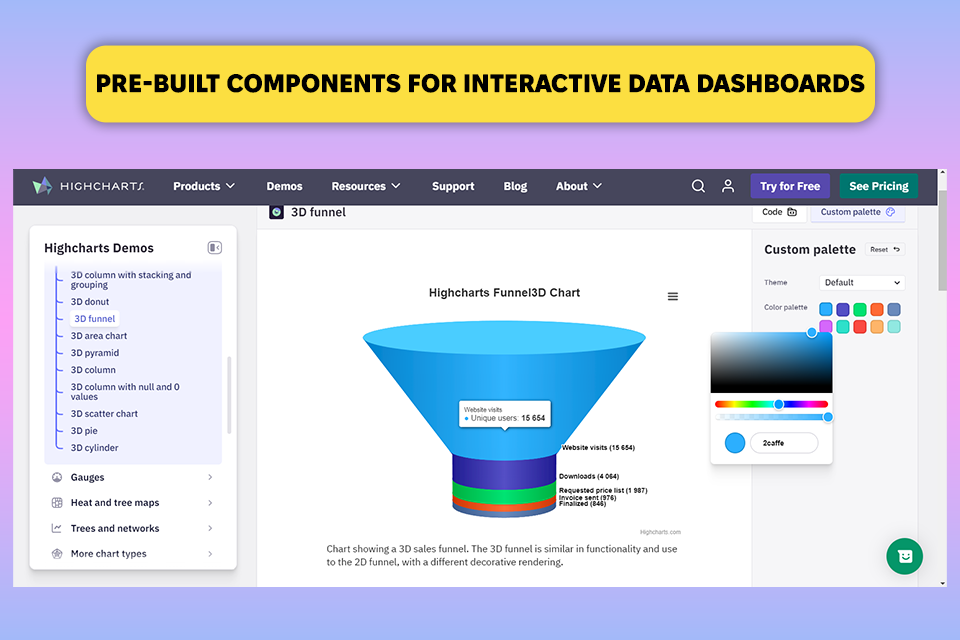
Highcharts is a wonderful Infogram alternative for showing key data as it lets me customize things and automatically sync data from different sources.
Compared to Infogram, this Infogram alternative gives you more freedom to control the code. I could use JavaScript to change every chart, making it fit the company’s brand. This made the report dynamic and responsive, especially when I resized the dashboard or added different parts.
Infogram’s templates are simple to use, so you can quickly make nice-looking reports without much effort. In contrast, Highcharts needs more technical skills to use. Regardless, because Highcharts lets you customize things and connect with different back-end systems easily (which Infogram doesn’t do as well), it’s a better option for complicated projects that need a lot of developer work.
Price: from $168, free trial is available.
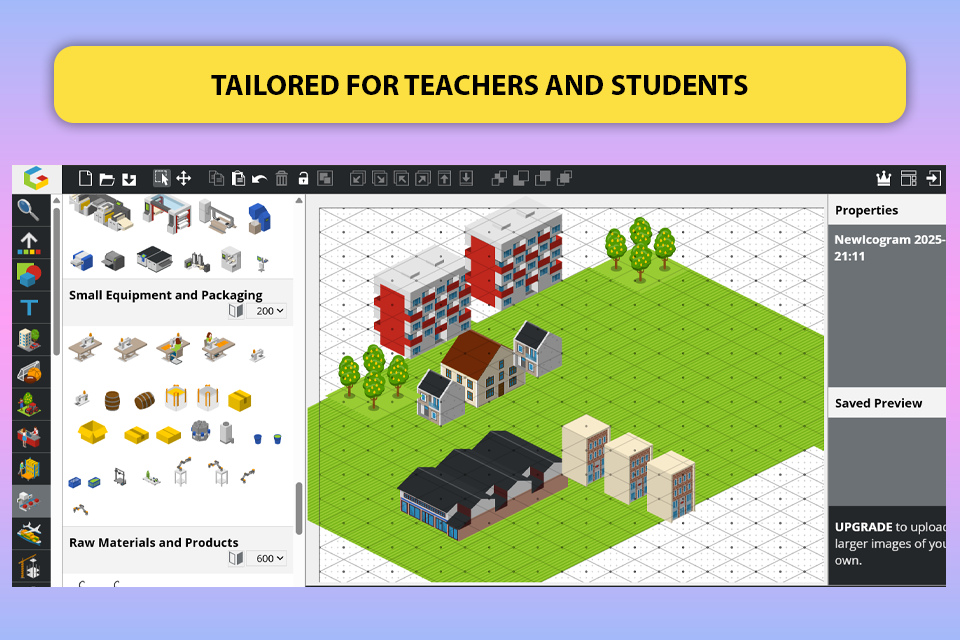
Icograms is a great tool to quickly and easily create 2.5D isometric maps, infographics, and illustrations. I found the drag-and-drop editor to be extremely intuitive to work with - no complex design knowledge needed to get professional-looking results.
The tool is accompanied by a large icon collection of over 4,900 icons and nearly 1,000 templates, ranging from construction and healthcare to city planning and logistics. The isometric design is uniform, and export to SVG, PNG is a great plus if you would prefer high-resolution images to be used in presentations, websites, or even game development.
One of the most striking aspects is the Education Edition, which is convenient to use by teachers and students. There is also ordering bespoke graphics but still having them edited online, offering flexibility to business users.
Price: free version or from $19 per month.
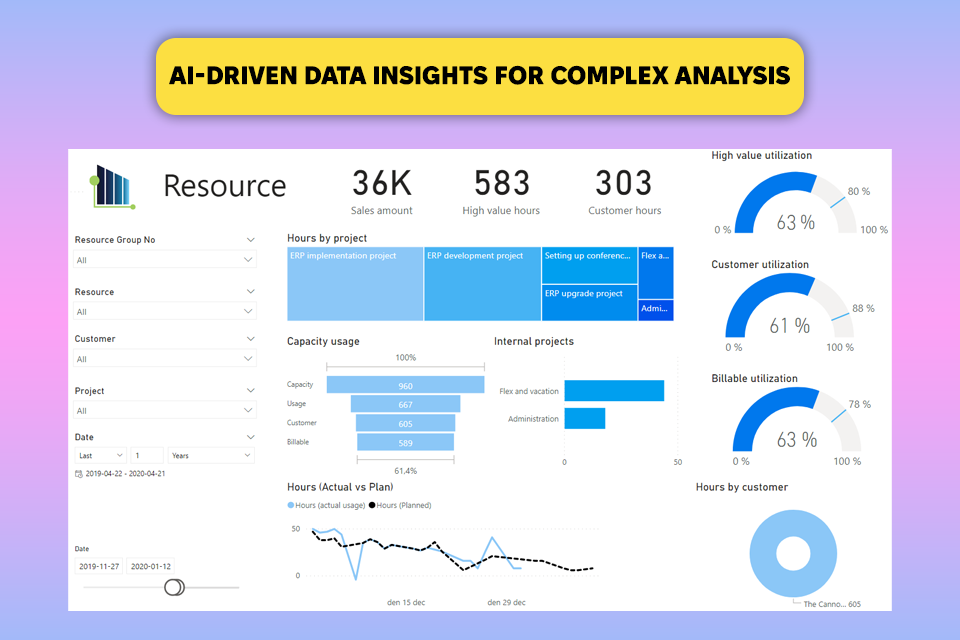
Power BI is good at handling complex data, especially in comparison with Infogram. I used it for big projects, like making dashboards for executives, where I needed to look at data in real time and create advanced visuals.
This data analytic platform connects easily to different data sources and has great AI tools for analyzing information. The Infogram alternative helped me create interactive dashboards that let the team explore specific data points, which Infogram wasn't as good at.
The visuals in Power BI are dynamic, making it the best choice for deep analysis and decision-making. However, it’s not as easy to quickly create nice-looking infographics as it is with Infogram. The interface can be powerful but might be confusing, especially for beginners or people who don’t usually work with data.
Price: free version or from $10 per month.
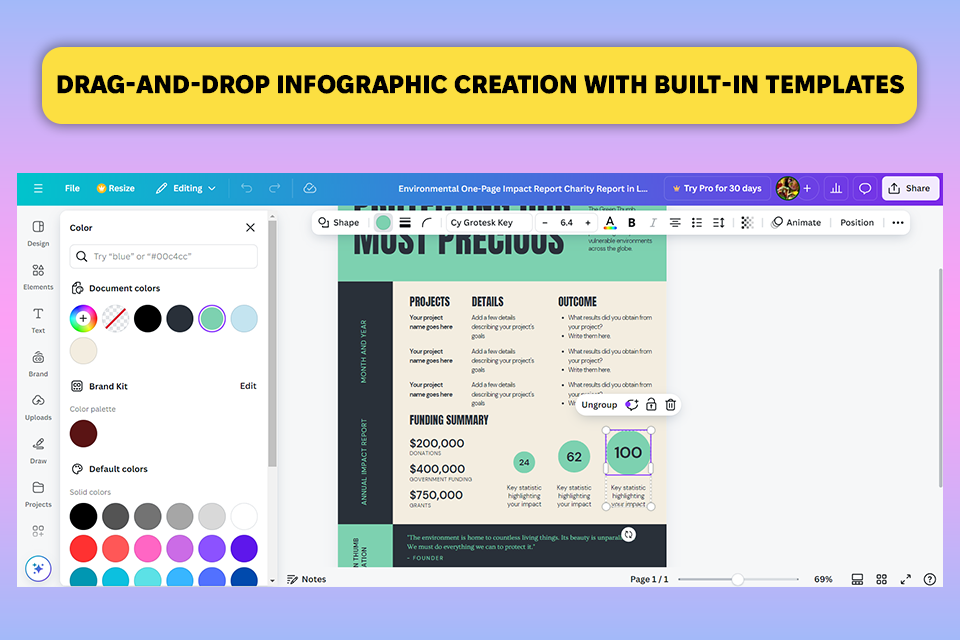
Canva’s drag-and-drop editor and its huge collection of templates made it easy and quick to create designs. I didn’t need any advanced design skills to turn my data into nice-looking charts.
Compared to Infogram, Canva is more user-friendly because it has a simple layout and many illustrations, which may be crucial for beginners. This helped me make my reports look better without taking too much time on design. The ready-made templates let me create dynamic infographics in just a few minutes, which is great since I usually have tight deadlines.
However, Canva isn’t as good for more complicated visuals that need advanced features or deeper insights. In my project, I needed more ways to customize the data visuals that Infogram provides, especially for charts that update automatically.
Price: free version or from $15 per month.