Network security for business covers various tactics aimed at ensuring integrity, privacy, and accessibility of data sent through networks. It is important to understand common threats and weaknesses to implement proactive security strategies that minimize risks.
Since I recently faced a data breach myself, I understand how important network security for businesses is. When adhering to the latest strategies, it is possible to protect valuable assets, maintain compliance, have uninterrupted operations, and preserve brand reputation and customer trust. Today, I want to share some advice that helped me navigate through that challenging experience.
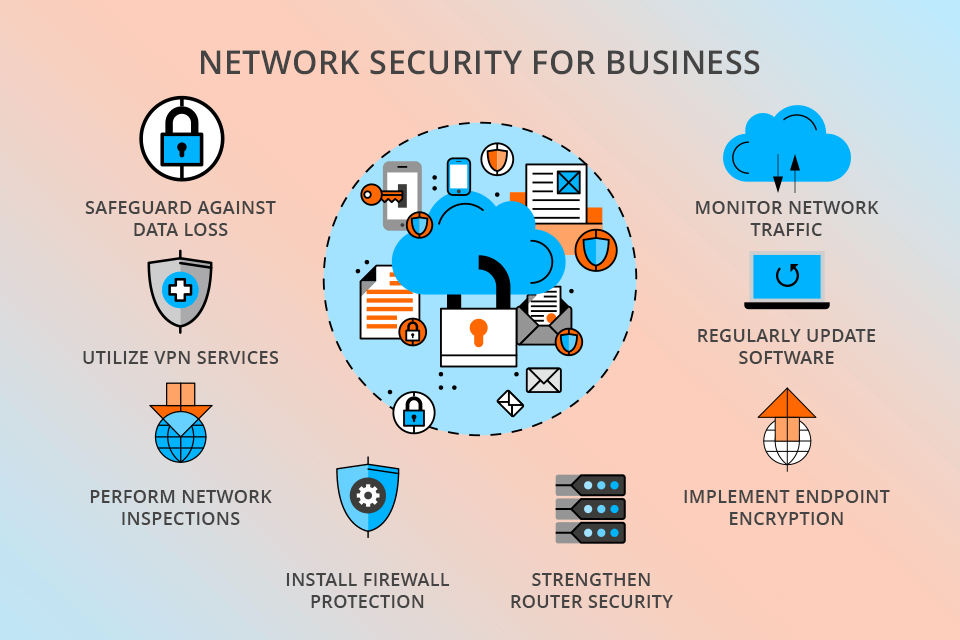
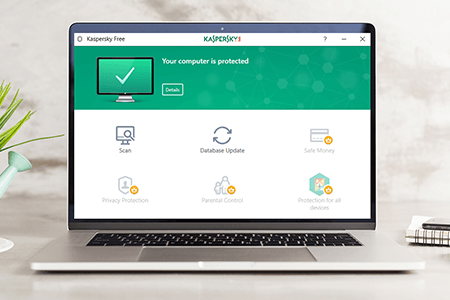
Make sure to install both a data protection solution and privacy management software for your network to shield your small business from data loss. Such a combination will yield the desired results even in the case of a network security breach. By preventing data loss, you can keep your business operations running smoothly. Besides, remind your staff not to share sensitive information or upload data to external servers.
Recommended program: Acronis Cyber Protect.
VPN is a privacy tool that conceals your online activities and connection details. Such tools provide comprehensive protection across all your digital interactions, not just within your web browser. This means they hide not only your search history from your internet service provider but also every app you use on your device.
Besides, VPNs enhance security by obscuring your real IP address through multiple layers of encryption. Thus, they reduce vulnerability to potential breaches.
A VPN makes a safe, secret connection over the internet, letting people reach a company's network from far away. Those, interested in network security for small business, use VPNs to keep the info exchanged between remote workers and the network protected from third parties.
For the utmost safety, I suggest privacy tools like Surfshark ONE that I’m using now, where providers don't save any info about your connections or what you browse online.
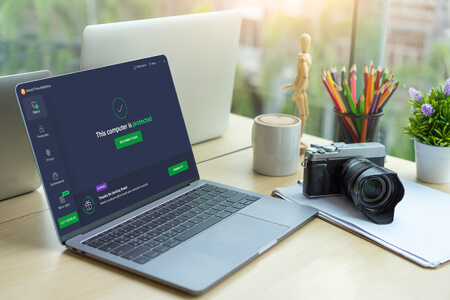
![]() I use this tool to block access to my camera from any unauthorized apps and alerts. In addition, it hides all of my IP addresses. What I really appreciate is how simple the setup process is, and I'm sure that even a beginner can manage it.
I use this tool to block access to my camera from any unauthorized apps and alerts. In addition, it hides all of my IP addresses. What I really appreciate is how simple the setup process is, and I'm sure that even a beginner can manage it.
The purpose of an audit is to find any security weaknesses. By running it, you can check for open ports that can let outside threats into your network and look for background apps that hackers may exploit. The audit is also helpful for assessing how strong your firewall is and checking if you have secure backups and antivirus software that's up and running.
Examining the network defenses is helpful as you can identify outdated applications and then upgrade or replace them with newer ones. Once it is over, you will receive an in-depth report. Share it with your security team, so that experts can enhance and adjust your network setup.
Recommended program: Nessus Professional.
Windows, Mac OS, and Linux offer full disk encryption. Usually, you can start encrypting a system without a user realizing it. It's important to store the encryption keys securely in a well-protected database or data store, in case you need to recover data later for business purposes.
In the past, people worried about losing data, dealing with complex encryption tools, and performance problems. Fortunately, none of the listed is still a problem.
While advanced users may detect a slight delay when accessing their data drives, most regular users won't even notice unless their systems are overdue for updates. Adding a BIOS password is one of the simple steps for ensuring small business network security. Unfortunately, this security feature is often overlooked.

In addition to using privacy tools for Windows 10 and other versions, small businesses need to set up a firewall to bolster their network security. By installing a firewall on all devices and servers, you can limit unauthorized access to your web applications.
Since external users often use web apps, it's crucial to carefully check incoming traffic for any suspicious activity. A strong firewall significantly lowers the chance of unauthorized access without causing concerns or attracting attention.
What's more, a firewall protects the databases stored on your computer systems. If you don't have a firewall, your systems are vulnerable to potential dangers. Hardware and software firewalls both help boost network security by blocking unwanted internet traffic. They work by following a set of rules that determine whether incoming or outgoing traffic should be permitted or stopped.
You can change these rules to match any updates in your network's security and policies. With this flexibility, you can easily make your defenses stronger and protect all your important information.
Recommended program: Sophos XG Firewall
| Aspect | Recommendations |
|---|---|
|
Location |
Put a router in a safe place like a server room, to exclude unauthorized usage. |
|
Passwords |
Make sure to change your router's login details from time to time, and use strong passwords that have a mix of letters, numbers, and symbols. |
|
Firmware Updates |
Make sure you're always using the latest version of your router's software to fix any security issues and to access new features. |
|
Firewall Configuration |
Set up your firewall to control the traffic coming in and going out of your network, so it can stop unauthorized access and harmful content. |
|
Network Segmentation |
Split up the network into different areas to control who can access what and to stop any security breaches. |
|
Access Controls |
Set up access controls to restrict the devices and users allowed to connect to the router, decreasing the chance of unauthorized access. |
|
Logging and Monitoring |
Turn on logging and monitoring functions to keep track of what's happening on the network, spot any security dangers, and take quick actions. |
|
Physical Security Measures |
Use physical security methods such as locks or protective enclosures to prevent anyone from tampering with or stealing a router. |
How you set up your network determines how easy it is for hackers to attack. If you reset the router, hackers may get full access to the network. Therefore, it is important to protect this device. To reduce risks, keep hardware hidden in safe places like server rooms to stop anyone from messing with it or causing accidents.
Furthermore, it's important that network administrators regularly change the login information for a router. Thus, it becomes harder for hackers to break into the network because they have to try many different password combinations.
When you use complex passwords to ensure wireless network security for businesses, attackers get discouraged, as it is difficult for them to hack into the router and access the network.
To ensure your small business is safe, it is necessary to regularly update all the software applications you use. These updates fix any weaknesses in your apps and stop hackers from creating threats that target outdated software.
Outdated software poses a big risk to network security as it can be exploited by hackers and other attackers to gain access to your data. Always update your software to be sure that you're using the latest source code and have advanced security features.
Using newer software versions puts you ahead of hackers who may try to exploit vulnerabilities. Therefore, you may not constantly worry about the security of your small business network.
It's really important to keep an eye on both incoming and outgoing traffic on your network using specialized intrusion detection software. Take the time to check all the logs and reports it creates, paying attention to anything strange or suspicious. Have someone on your team go through the data and act quickly if they find any unusual network activity.
Using effective traffic monitoring methods, businesses can find and stop possible attacks right from the start, while also keeping records of how people access the network for further investigation.
Recommended program: SolarWinds Network Performance Monitor
Network security for business implies keeping networks and their assets safe from unauthorized use, changes, or disruptions. For businesses, it's vital to protect their networks to avoid data breaches, cyberattacks, financial harm, and loss of trust from customers and partners.
Businesses often deal with malware, phishing scams, ransomware, threats from within the organization, insecure network settings, unauthorized access, and denial-of-service (DoS) attacks.
In many cyber security blogs, it is written that you should use firewalls, intrusion detection systems, encryption protocols, access controls, regularly update security measures, organize employee training, enforce secure password policies, divide the network into segments, and keep track of network activity through monitoring and audit.
VPNs offer a secure way for employees to access business networks from remote locations. They encrypt data transmission, preventing unauthorized interception. Besides, VPNs enable businesses to circumvent geographical restrictions and establish secure connections for remote offices or employees.
As criminals target mobile apps and devices more often, it's essential for small businesses to focus on securing network access. Configuring connections for mobile devices on your business network helps keep network traffic private and secure. Also, you can limit mobile apps to use specific protocols and follow established standards to stop unauthorized data transmission on the network.