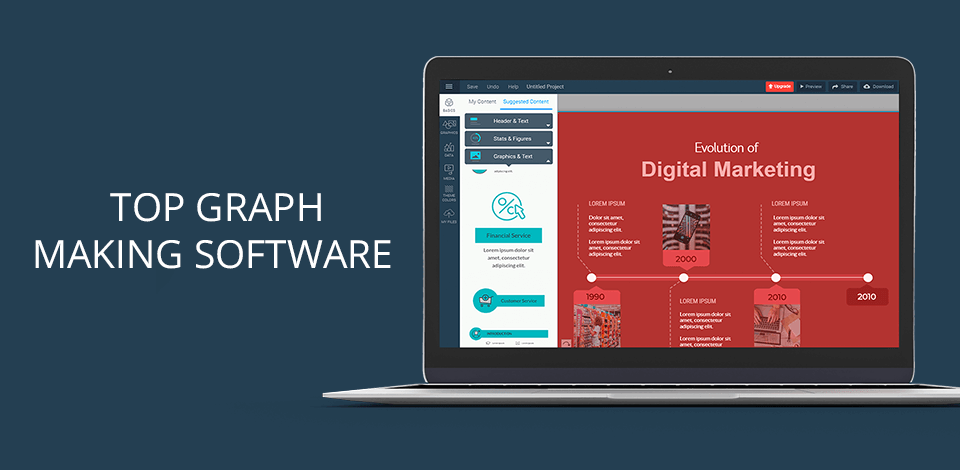
The best graph making software completely changes the way you can work with regular charts and graphs in order to visualize data. We are used to creating graphs whenever we need to organize large assets of data in a more comprehensive way and highlight certain details. However, a traditional approach to building charts lacks an important visualization component and the best graph making software can fill this gap.
Such programs come with the tools needed to create bar and pie charts, scatters, bubbles, radar, funnel, and even Gantt charts, so you can give any information a more apprehensible form.
Verdict: You should know that Visme is one of the leading companies in the creation of printed and digital chart paper. The graph paper that they create is high quality and comes at affordable prices as well. The graph making software that they offer is the perfect tool for creating professional-looking graphs no matter what type of paper you are using. They will even include an easy to use drawing tool so you can quickly create your chart.

Verdict: FineReport graph making software is a program for producing high quality, professional-looking business dashboards that can be easily exported to Excel. There are many users of this data visualization tool, who can attest to its capability and the reality that it is one of the most advanced tools available in the market today. One of the reasons why this particular program is very popular is that it can be used both in Excel and in plain-text format. You can also export the finished product into HTML or any other format that you prefer to use the many available exporting options.

Verdict: With Adobe Express you can only create four types of graphs, including circle, histogram, line, and ring chart, but choosing a color scheme is easy. Enter your data, choose a chart and a color scheme; then you'll see a well-designed chart. You can save your chart for printing, publishing, or importing into another project.

Verdict: Google Charts is one of the most popular charting tools and free diagram software on the internet today. If you have a Google account and are willing to spend a little bit of time, you can really create some amazing presentations. You can use the Google Charts template to create a number of different designs. If you want to just draw circles and squares, or simple line charts, then you can do that as well.

Verdict: The server that this software runs on is extremely user friendly. If you have never heard of RawGraphs software before, you should know that it is not hard to use at all. The way the software works is that you can export data into different formats and then you can use a custom palette to customize the colors and logos that will appear on the chart. After that you simply need to draw the graph on your own computer.

Verdict: Livegap is a completely free charting site. It has a simple user interface with three panels. These three panels are respectively used for displaying charts, setting styles and entering data. Data change is displayed on the graph in real time. Besides entering data manually, you can also copy it from Excel or any spreadsheet. Graphics can be downloaded in PNG or HTML format and saved online if registered.

Verdict: The main goal of this product is to provide you with professional looking charts with no prior experience in creating the same. One of the best things about the product is that it allows you to plug in your own data as well as you data from another source. There are many functions available and these can be customized according to your needs. You can also save your charts in PDF format so you can print them out and use them for presentations or just sharing them with others. The charts are created in a Flash application and the software includes support for Microsoft Word as well as Excel.