The best statistical analysis software includes all the necessary tools and functions for working with statistical data. They help organize, interpret, and present specific data packages. As a rule, such software contains tools for managing data and performing various manipulations with statistical information.
These tools use a variety of analysis methods, such as predictive analytics, regression analysis, and so on.
Below, you will find information on the best statistical analysis software for your business. All the options on this list include excellent toolsets to speed up the statistical data processing.
Verdict: MaxStat is one of the leading statistical packages that helps business people to manage and analyze the statistics from their data sets. This data visualization tool has many statistical features built in it, which make it easy to build reliable and effective statistical models.
MaxStat has a number of built in features which include but are not limited to the following features: creation of different types of statistical models, tuning of the model parameters using mathematical expressions, trend interpretation using statistical indicators, plotting a data set based on the given parameters and analyzing the data sets to get statistical significance.
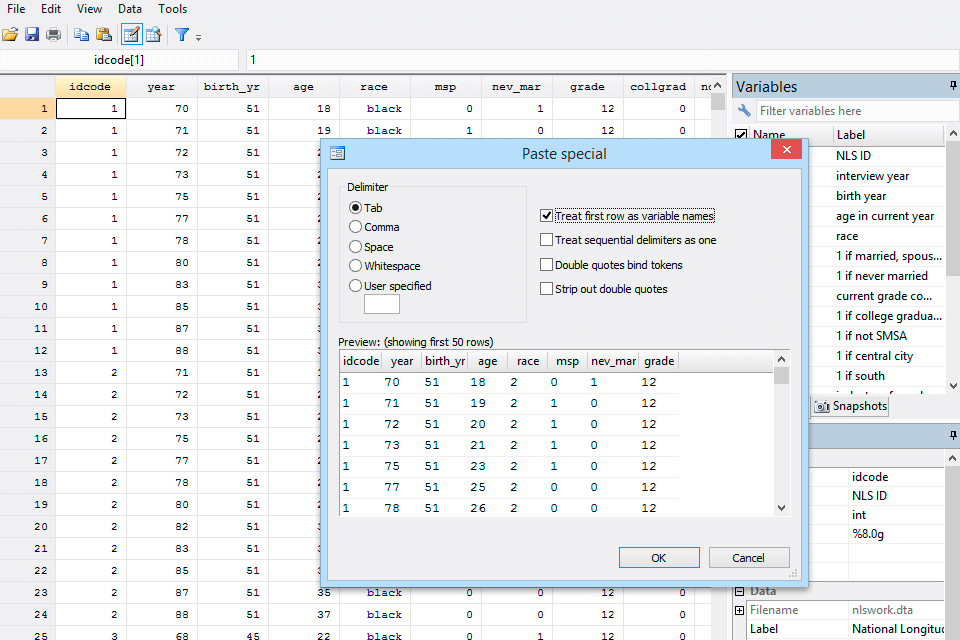
Verdict: WizardMac is one of the best statistical analysis software available today to help small business entrepreneurs understand their market better. With a simple and easy to use interface anyone can do advanced statistical analysis of data that comes in.
This free graphing software comes with a graphical user interface (GUI) that makes it easy to plot graphs and statistics from multiple types of data sets. It also comes with a powerful sorting and grouping capabilities that make it very efficient for analysis.
Verdict: NCSS is the best way to analyze the data you have collected and to find patterns. This makes it easy for anyone to use, but is not meant to be used as their main statistical tool. Instead, it is designed to be used in conjunction with other types of analysis, such as linear and logistic regression.
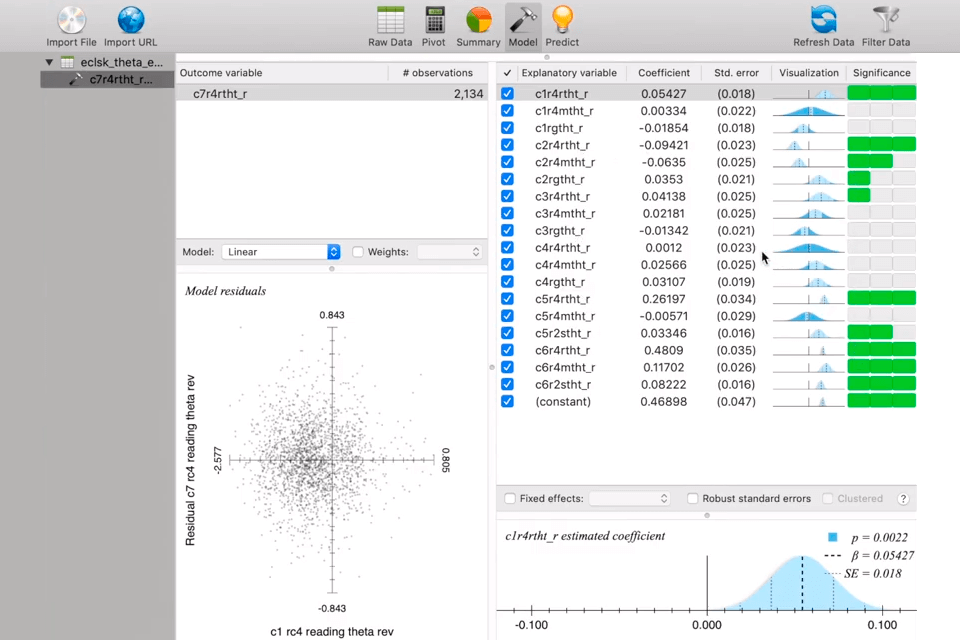
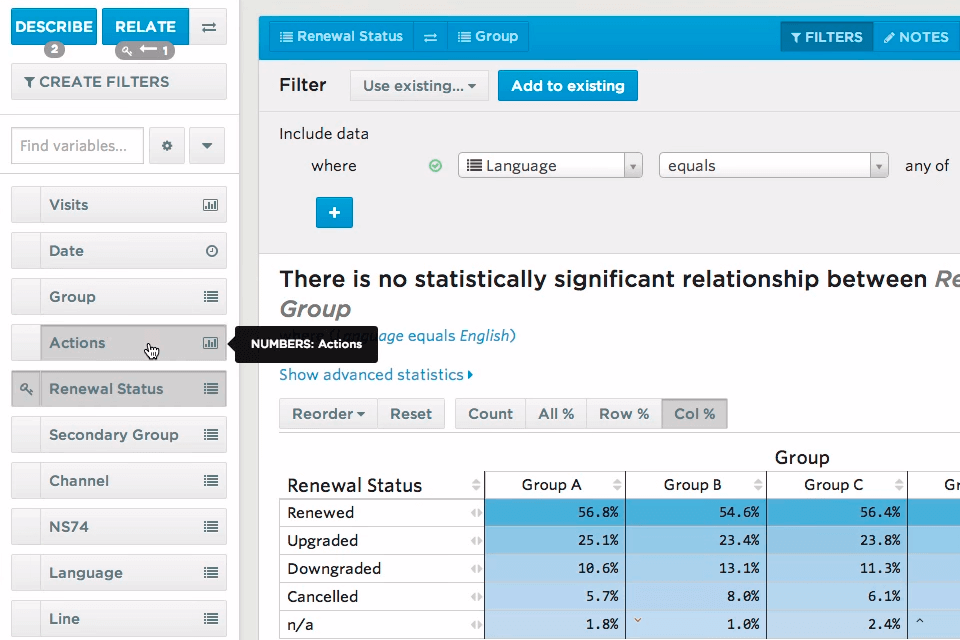
Verdict: Statwing is one of the best tools you can use when it comes to exploring your market data. If you want to find the trend of a certain area, a certain industry or stock price over the long term then Statwing could be what you are looking for.
This is because Statwing's graphical approach makes the trend more obvious and easy to follow. If you are not that comfortable with statistics but would still like to explore the market using this statistical tool then Statwing could be a great alternative. It comes with the best features of graph making software and will allow you to make the best decision possible when making your decisions.
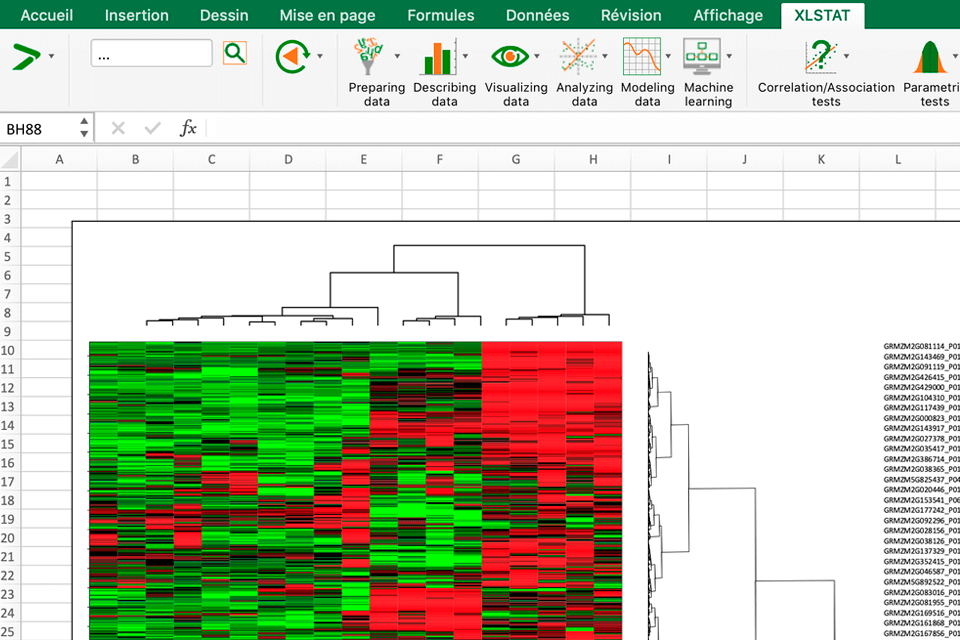
Verdict: XL STAT has many benefits but the most important thing to consider when purchasing this type of program is what statistical methodologies can it use to make its statistical models and projections work. Although this program comes with a wide range of statistical procedures, it does not allow users to directly plug in their own data or even more importantly their own statistical formulas because it is more geared towards the continuous analysis.
You need to have a continuous process of analysis if you want to make any statistical projections and this program is designed for that. If you are someone who loves to create graphical representations and would like to use statistical analysis software to represent your data then this tool may not be the best one for you. It is best if you are someone who enjoys creating your own models and projections because this software is not the best one for the purpose.