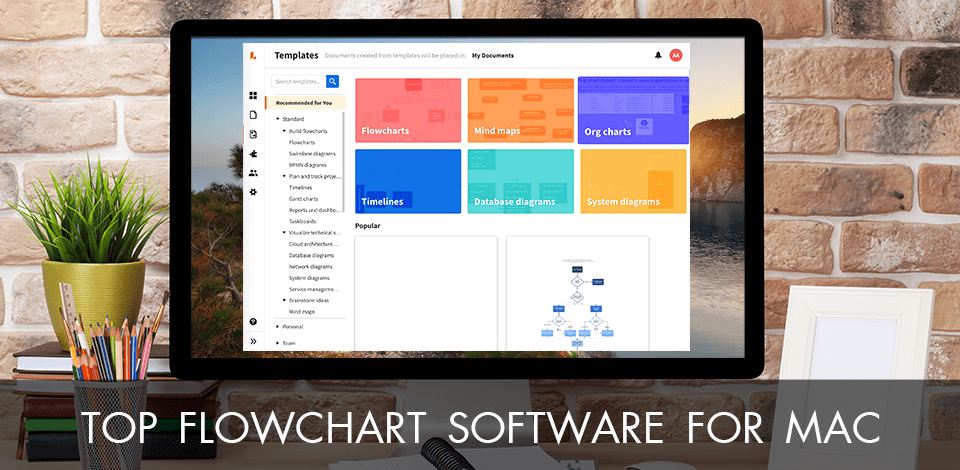
Using the best flowchart software for Mac you can inform new staff members about common practices, set out a project’s timeline, generate mind maps and organize charts for colleagues.
Flowchart software provides pre-designed templates and drag-and-drop platforms allowing you to effortlessly build personalized diagrams. Plus, it enables team members to easily cooperate on projects.
Since it may be difficult to choose the best flowchart software for Mac, we have tested 7 platforms and are ready to name optimal programs for various organizations.
Compiling the list, we focused on the platform integration, team collaboration features, template design choices, price, and simplicity of use.
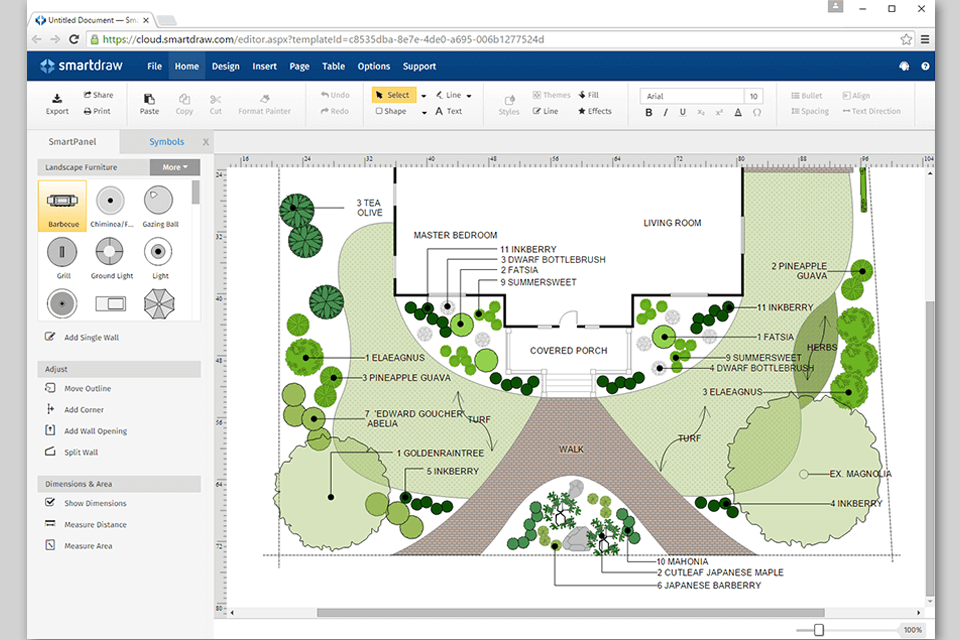
Verdict: SmartDraw will allow you to draw different kinds of diagrams such as learning to draw balance sheets, bar charts, pie charts and more. It has many options for integrations so you can work with your familiar programs. You can found 70 chart types and over 34,000 shapes and objects in the library.
It allows you to save a lot of time as it allows you to easily save the drawings that you make. It comes with features such as tutorials, support for a wide variety of formats, and allows you to make some very detailed flowchart.
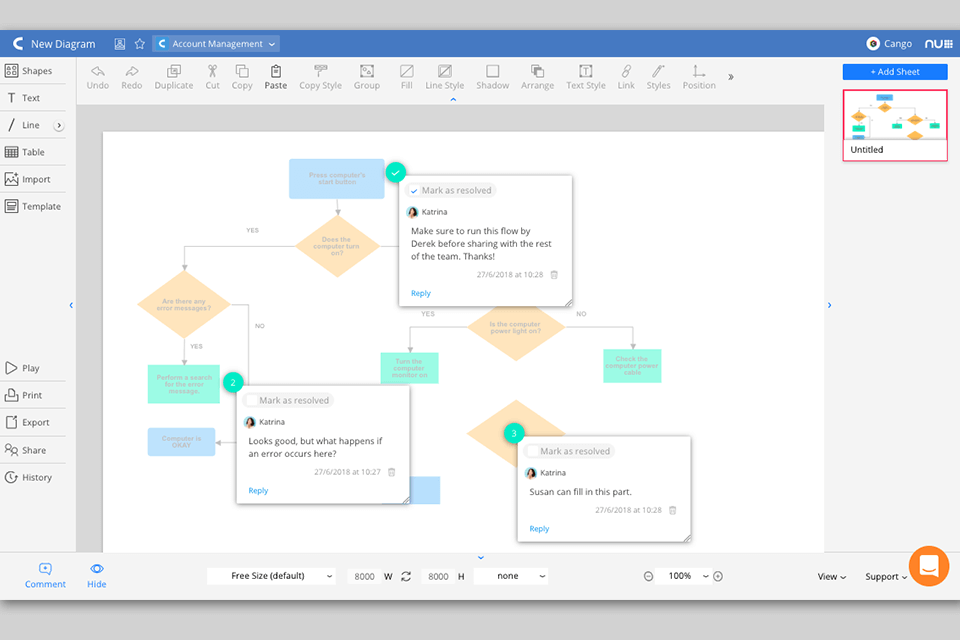
Verdict: You can learn how to use Cacoo quickly and easily. This is because you can import your data from Microsoft Excel, other spreadsheets, or even Power Point presentations. Once you have imported this data, all you need to do is create a new chart by using the fields that you have specified in the spreadsheet. In addition to the fields in the spreadsheet, you can also select the type of chart that you would like to create. You can modify the appearance of your chart by selecting the color that you want to use. After that, you can save your chart in PDF format.
This free diagram software allows you to easily plot different types of charts. Since all you have to do is drag and drop the data into the chart box, you are immediately able to create a chart with the data that you have entered. If you need to add extra images or text to the chart, you may simply click on the "olor" drop-down menu before dragging and dropping your data.
Verdict: This type of charting software is easy to use and comes in many shapes, sizes and formats. You can have Lucidchart in black and white or you can choose to have it in color. All you need to do is plug in the data that you want to convert and then just click on "Fit", right-click your chart and then "Save". With this free flowchart software, you can even preview your layout in several different colors, widths, and heights to make sure that everything looks perfect before you actually print.
The first thing that you should keep in mind is that you should always include a title with your chart. Once you have a title and you are ready to go, the next step is to choose which format you would prefer to put your chart in.
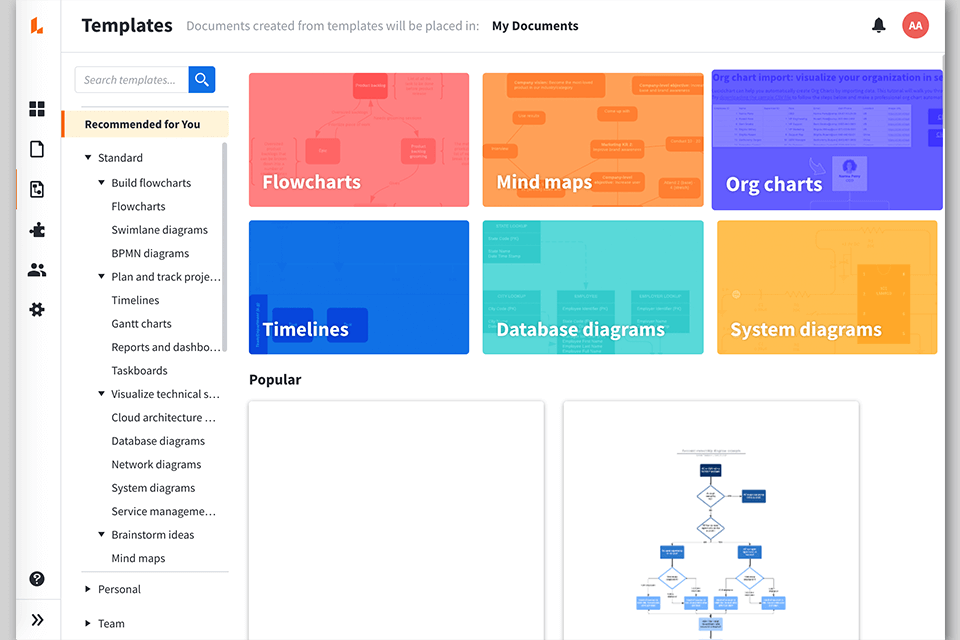
Verdict: With the help of the Omni Grafittles, you can make a lot of different diagrams, including bars, line plots, scatter plots, points, histograms, data tables and network diagrams. The program contains tools such as the draw spline, curve spline, bar chart, pie chart and the scatter plot. The graphic utility feature allows you to draw lines, shapes, text and images and you can combine them to make a dynamic visual presentation.
This powerful program allows you to convert complex data or complex figures into simple graphs or images. For example, the program allows you to rotate, skew, zoom, pan and combine any number of pictures into a single picture by using the drag and drop feature.
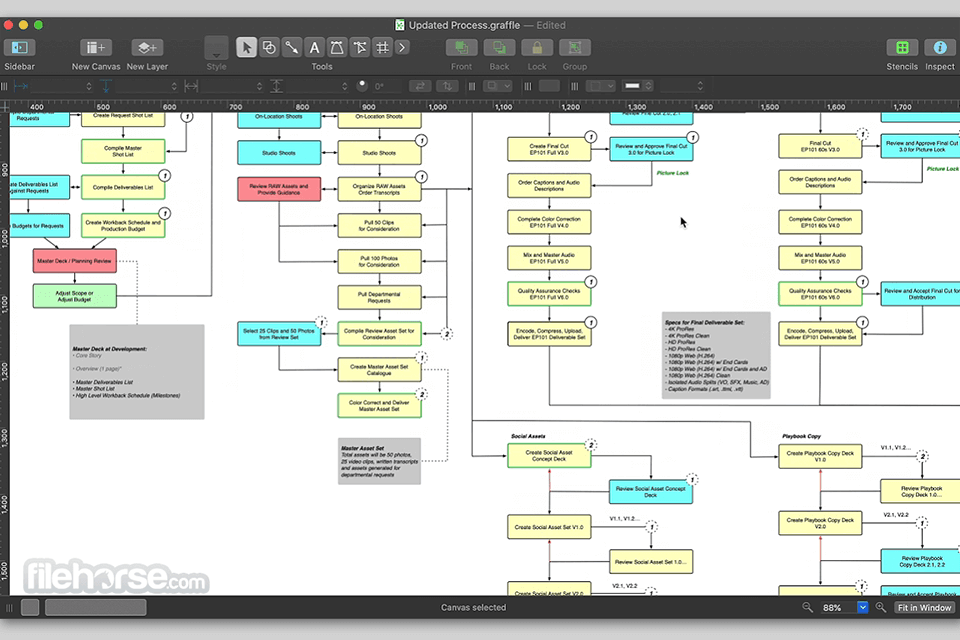
Verdict: ConceptDraw is a fast and efficient program, making it an ideal choice for diagrams that need to be produced quickly. It is easy to use, with its drag and drop functionality allowing you to place your objects in places you want them. You can draw anything from simple shapes to more complex 3D images.
The templates that are offered come with the program, but you can also download some additional ones from the Internet, should you require some more unique designs. In terms of price, you can expect to pay around forty dollars for a one-year subscription. This will give you access to everything the application has to offer, with any further upgrades available at a fixed price for the next year.
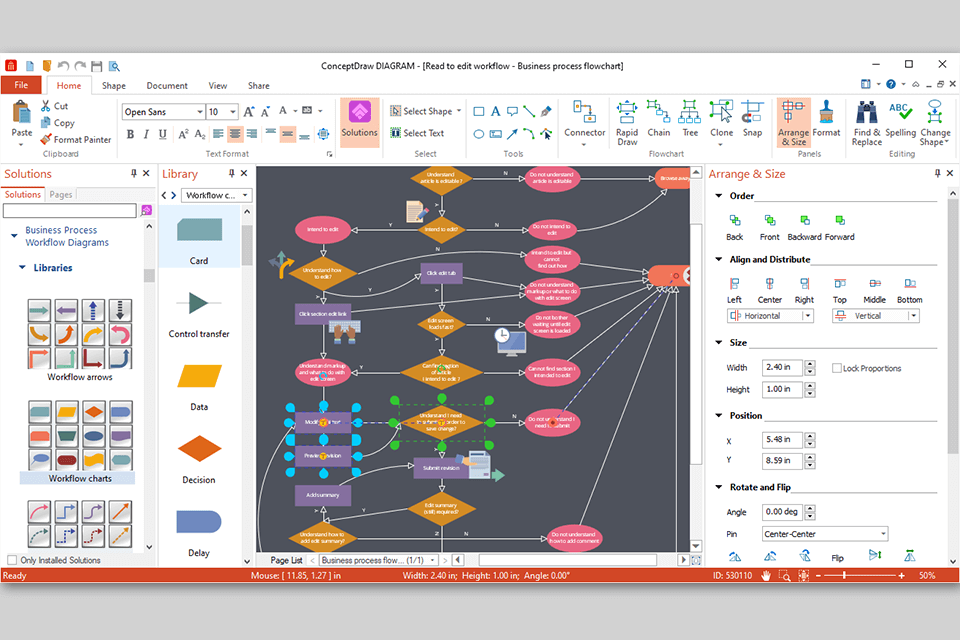
Verdict: Creately can help you create fantastic looking spreadsheets quickly and easily. The software is designed specifically to work with PowerPoint. This program is very easy to learn, so you don't have to worry that it will difficult to use.
This block diagram program comes with over 70 diagram types and huge set of templates. It even has a few "starter" templates. Once you've started working on your own custom made charts, you can create an unlimited number of different ones. That means that you can make an amazing chart on any topic, and have the finished product to look exactly how you want it to.
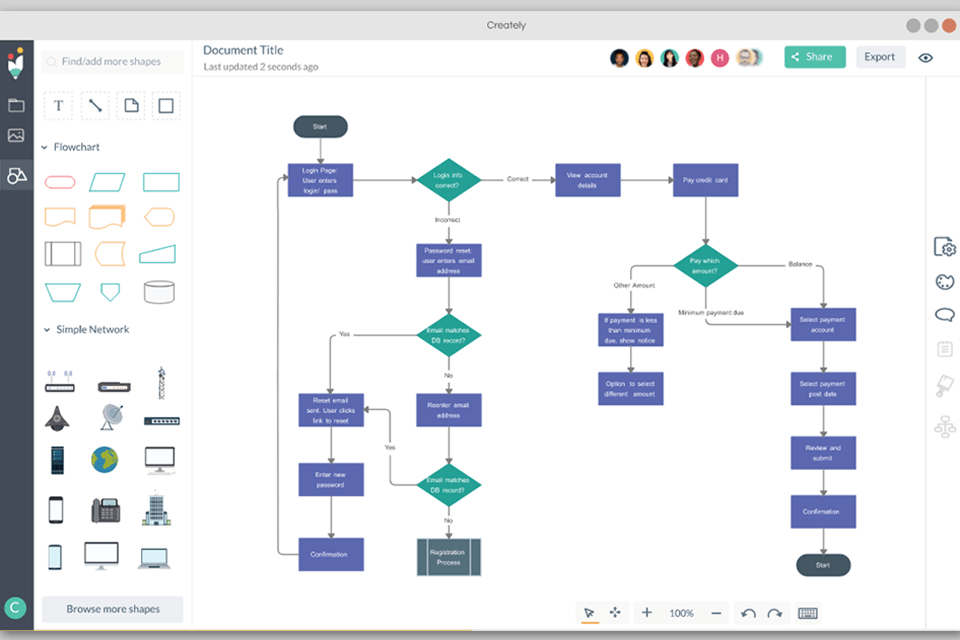
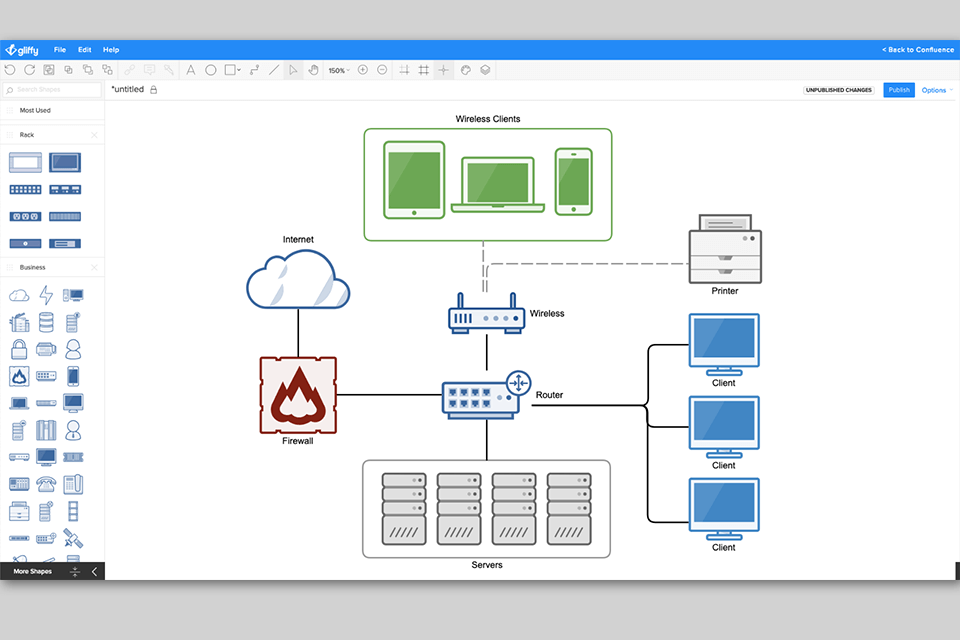
Verdict: Whether you are interested in creating charts for sales, for customer orders, for inventory, for billing or any other type of chart that you desire to make it easier for yourself. Gliffy is easy to use and can save you time when creating your chart.
It is designed to help you learn how to create any type of chart that you need and then have it printed out quickly. The price of the software does not go up over time and you can easily have a chart made in the amount of time that you have available to you.
