Visme Online Design Software Review 2026

Verdict: Visme Online Design Software is an online visual content creator that helps you scale and control the presentation and transformation of information and multimedia data into visually appealing infographics and interactive presentations, centralizing all media resources. With its professional-looking templates, even a novice can create a vast array of designs for professionally branded products, from online forms to printed documents: posters, brochures, business cards, advertising banners.
Even when offline, this web-based tool is widely used by professionals from the fields of education, marketing and management. Visme is powerful enough for graphic designers. It combines drag-and-drop simplicity, flexibility and interactive features to create content that is interesting to the audience.
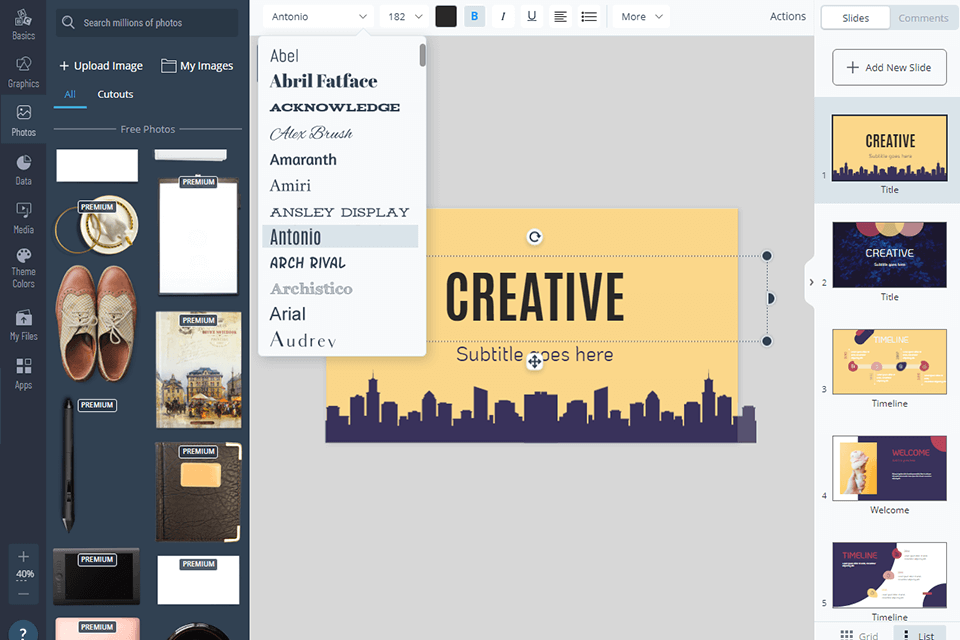
Publish online, embed on a website or download for offline use – Visme changes the way visual formats are exchanged. As a cloud-based collaboration platform, it lets managers organize their projects in folders, sort and classify files in the database, configure access controls, grant role-based permissions to related groups or individuals.
The platform offers automation capabilities for posting content online, publishing, displaying and sharing content. It lets you set time for automating online presentations and for analytics to track publication performance.
Complete Visme Online Design Software Review

Visual storytelling is a method of transmitting data and ideas through visual media that lets you act through graphics, illustrations, photos, animations and videos. Content marketing’s need for engaging and attention-preserving graphics is essential to the success of marketing campaigns. It helps marketers improve interaction and ad recall, increase ROI and reach their audience.
Marketers are attracted to data as surveys of potential customers because it can tell a good story. Therefore, infographics and presentations are one of the preferred tools for visual storytelling, whether it is a speech at a conference or network event, a presentation of results to management, or a commercial offer. Visme as an infographic maker meets the needs and capabilities of design, so making a presentation becomes the simplest part of your preparation process.
Thousands of Flexible Templates, Themes and Slide Layouts
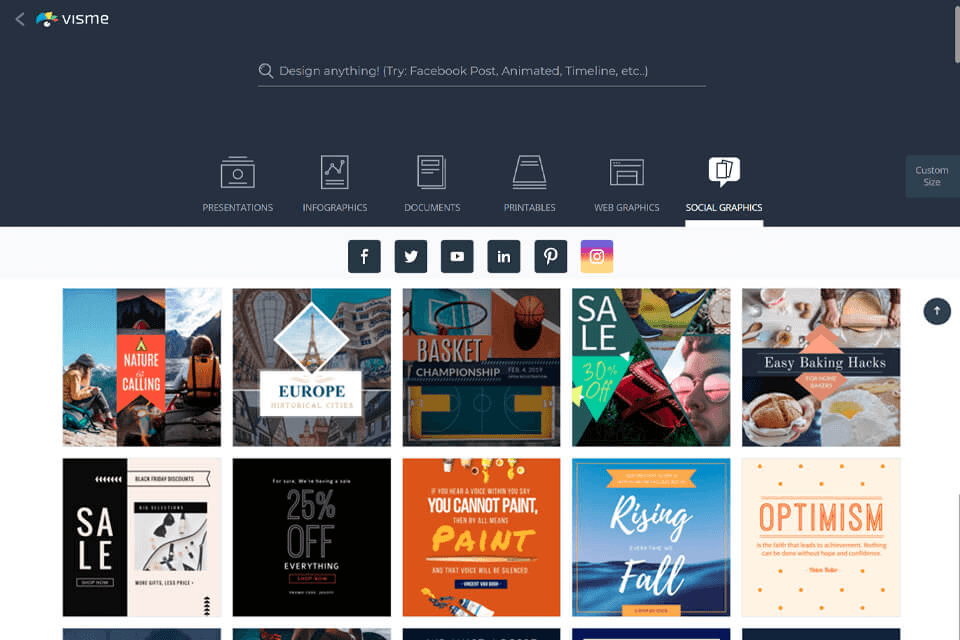
To ensure that your presentation has a unique and attractive format, Visme offers 100+ presentation templates and themes with a clean, creative and modern design. Customizable Visme templates are ideal for presentations that fit the purpose: sharing, comparison, timeline, reports and charts, information, hierarchy and instructions. You can choose templates based on keywords: anatomy, business, sales, etc.
If you need multiple presentations for different purposes with a similar look, themes are perfect for you. In the classic theme of online slideshow maker, you will find 400+ slide layouts, and in a modern theme – 900+ slide layouts that exactly match your presentation vision. You can create your own style by searching for graphics, photos, data and media in the library, or by uploading your own content.
Flexible Settings with Granular Control Over Content
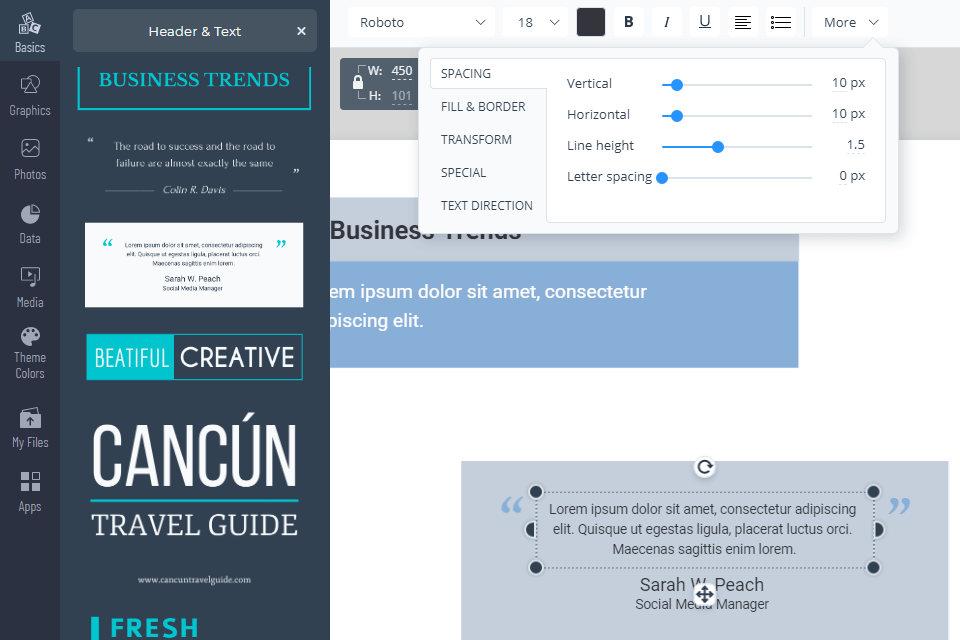
Along with a full set of graphic parameters – millions of embedded images, widgets, titles, fonts, icons, backgrounds – there is an extensive toolset that lets you customize the published content as much as possible. These tools allow you to import third-party content and then edit it using the available templates.
You can enable a grid layout to align elements and help guide the margins. Also, feel free to set the exact location and angle of the graphics. This way, when you try to align different elements, it is always successful.
You can move elements back and forth, control transparency, animate elements so that they appear in the field of view when you want them to. Instead of selecting a color with clicks, enter a hexadecimal code or adjust the brightness/darkness to find the desired one.
Lead Generation Tool and Analytics on Views and Interaction
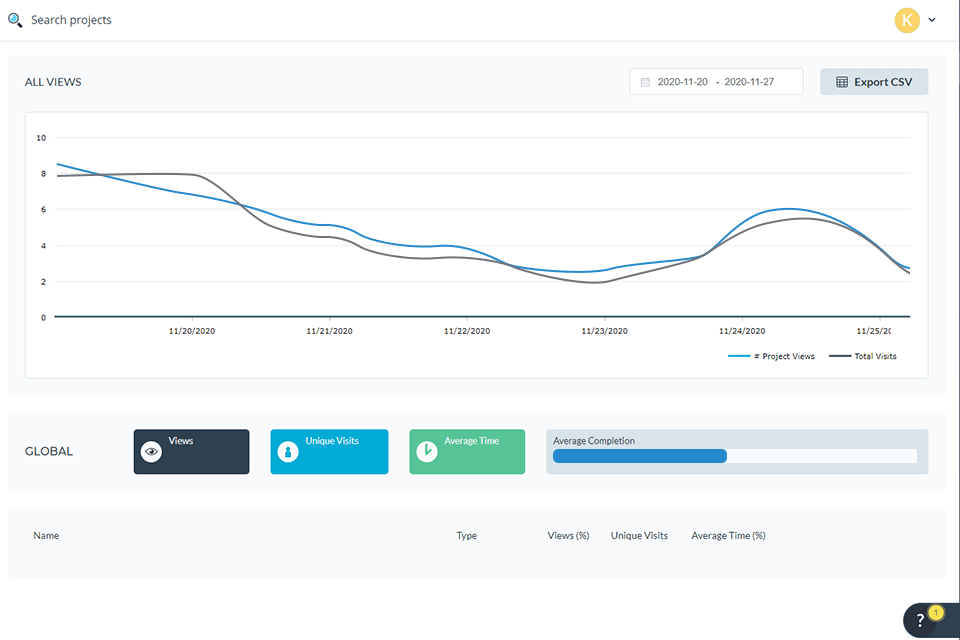
You need to evaluate how effective the published content is in order to make changes to webinars and other projects based on customer feedback and experience. Analytics helps you track the number of unique visitors, the most viewed content, and the time spent on the site by each user. Managers can upload this data as reports in Excel or as an interactive line graph based on an updated data table.
The platform may be used for attracting potential customers. Create a pre-recorded webinar or interactive presentation to generate a list of email addresses by sharing it with your audience and enabling the option that requires registration. This will let you collect contact information from those interested in your private content.
You can view the results of your form in the toolbar to upload data to the CRM or e-marketing platform.
Brand Kit to Elevate Your Business
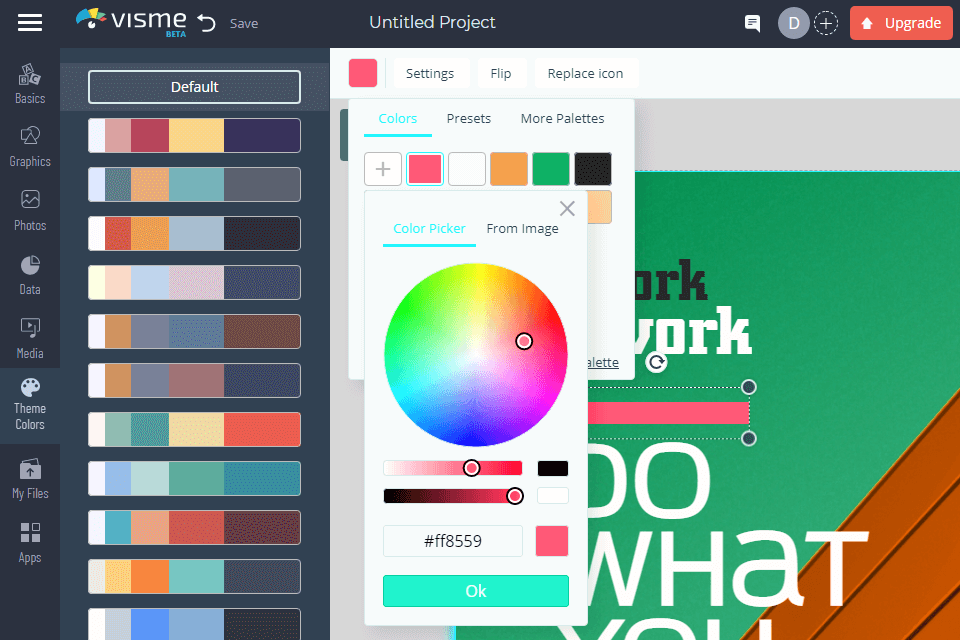
In Visme, you can create a complete brand kit in your business account: colors, fonts, logo, etc. The presentation is hosted on the Internet, so the selected fonts you have uploaded remain in place. You can upload different color schemes and themes in the presentation design, and they will remain in the color selection list for easy access.
Your brand kit includes an area for adding templates that you often use for your business, various logo files, as well as quick access links for your website and social media platforms. Another nice feature is the library of final slides that are often added to presentations.
Let’s say you created several presentations but changed your Twitter and Instagram IDs during the rebranding process. You don’t need to view each presentation to update this information. Go to your slide library, correct the information there, and it will automatically replace the old markers in each of your presentations.
Interactivity Brings Your Content to Life
Whether you are hosting a live presentation or embedding a slideshow on a website, you can create links, call-to-action buttons, pop-ups, hovering, move around the presentation, and add other interactive features that allow the audience to interact with the content. A hyperlink, slide or pop-up window is an excellent way to engage your audience and provide interactive features, such as creating a quiz or question/answer in a presentation.
Adding video/audio messages, embedding online content in slides is easy without any workarounds. Adding audio lets you upload an audio file or record audio directly to a slide. Another feature is the ability to create interactive animated infographics. Visme is the best Canva alternative, so it is possible to create a unique infographic in a long format that changes as you scroll. To do this, you need to export/publish it as an HTML5 infographic.
What’s impressive is the animated graphics that fall into three categories: illustrations, symbols and gestures. Characters can be people dressed casually or professionally, mascots or bots. Drag the character into your project and it will move and wave its arms.
Next-Level Sharing and Publishing
With Visme, you can share content on social media platforms, publish content online on other sites, or make it private, embed it in the generated code on the site, or upload it for offline use in various formats. Anyone who gets the URL can view the project as a website even without an account. Projects will be available for viewing on any device, and you can get analytics about views.
It is possible to send a presentation for editing, commenting and viewing only. You can share it with specific people by name, email address, or groups of people in your team settings. You can set user permissions: grant editing access to a group of administrators and view-only access to a group of regular users in your team.
If you have created a presentation folder for a specific topic or report type, you can easily share it with your teammates. Besides, Visme offers an HTML5 download feature for offline presentations, which is useful when you are hosting a presentation in places where you aren’t sure about Wi-Fi access.
50+ Charts, Widgets and Maps Help Tell a Story with Data
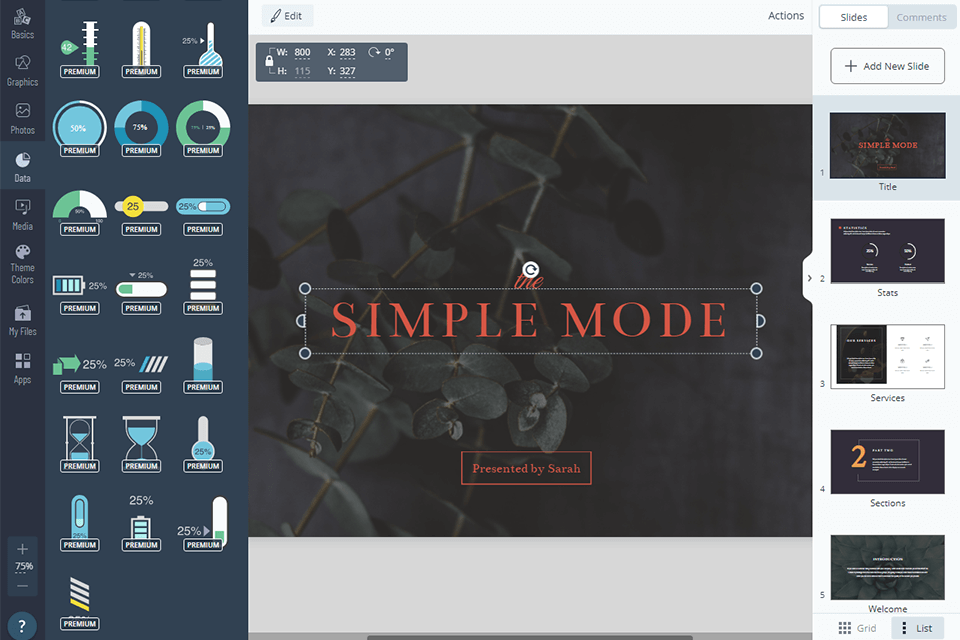
Including charts and graphs in your presentation is the perfect way to present data in a visual way and offer a compelling argument to your audience. Data visualization for transmitting research, statistics and the latest news will inform you effectively. You can start with a ready-made slide from one of the topics. There you will find radials, statistical views, thermometers, progress bars, histograms, line graphs and more.
After selecting the data visualization tool, the Graph Engine will appear, letting you further customize the chart or graph. Add data manually to the provided area or import it from a Google or Excel spreadsheet. Then update the settings to customize the axis information and more.
Visme automatically animates individual chart elements so that they attract the attention of your audience. You can pick from four different chart animation options or disable it.
Visme Online Design Software Prices
Currently, there is a Visme free version that offers limited use by a single user with the addition of the Visme brand on projects. If you don’t want to put up with these inconveniences, purchase a monthly Standard plan from $15/month for individual use with guarantees of updates, technical support and refunds. A Business plan starting at $29/month will add all premium access, branding, SEO and teamwork tools.
If you need additional security and the most advanced settings with an unlimited number of projects, you can request an Enterprise plan, the cost of which is negotiated individually. There is a volume discount for 10 or more places.


